Brooklyn Public Library
Leave a reply
I think the technology incorporated into GIS is extremely useful because it provides us with a way of uploading or rather copy and pasting information into a database called Carto DB. I appreciate the fact of being able to create your own personal maps to use as a display for not only a class project but anything that’s map related. GIS allows us to access small repository of datasets and a variety of base maps. I think its wonderful to be able to upload and visually create a map with data of your choosing. GIS is a great new technology that I think can benefit a lot of people.
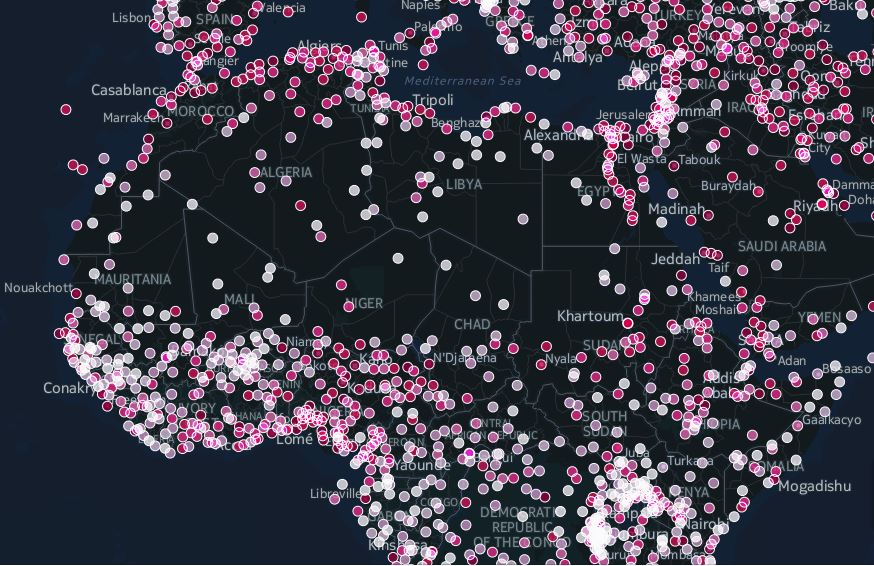
(Pictured above is a GIS exercise I completed)
GIS has been and still is a very influential and liable tool from the time it was born in 1963, to today and probably will be the king of all tools for as long as humanity continues to reconstruct the space we live in and as long as we need a reliable source to pull out information on a region we are researching or working on. Over the years GIS and the purposes for GIS has transformed, but its transformations have been used to better serve the community as almost everyone uses GIS.

It was enthralling to learn both about the genesis of GIS and the concurrent application of GIS. Although we did not use GIS on Thursday, we learned the basics on how to use a similar system called CartoDB. Above is screenshot of a map I had made from the website, which aims to study the pattern of graffiti complaints in NYC for the past month.
Both GIS and Cartodb function from a database in which information can be extracted to formulate visual representations. Visual representation or aids can facilitate different methods of analysis, or learning which are highly applicable for research and planning methodologies. While the art of mapping has started in the 1700’s, GIS has enabled multidisciplinary fields to track information in gratifying ways since the 1980’s.
Information can be understood in a series of plots, shapes or colors that in the context of the map, creates a new form of investigation. New patterns are plotted on a map, which are endless: they can can either be topography of a place, which is helpful for landscape architects, for tracking traffic accidents, which is helpful for transportation planners, for studying income brackets in a neighborhood, which is helpful for urban planners, and even for studying crime, which is helpful for the police force. All these possibilities make me feel quite fortunate to have access to these tools, as there is an endless sea of open databases on the web.
Maps are a diagrammatic of representation of an area of land or sea showing physical features, of cities, roads and much more. Maps are used as historical information which is documented and possibly preserved and housed within an archives in a library somewhere. We use maps as a guide when we need to travel from point A to point B. Whether or not we see it as such we travel on a map everyday of our lives from the street we walk down, the trains we take to and from school and even the planes we take to travel when on vacation; it’s all a map. I thought this article tied in so well with our site visits to the library; because it helps use to grasp a better understanding of maps in a much broader prospective. It gives us different ways of using and accessing historical maps.
My group and I arrived at many conclusions on Vinegar Hill from 1820-1870. We believe during that time, the Ferry Lines refocused the neighborhood, and when photography was introduced in 1839 that changed how every thing was documented and collected. We also believe that during that time, the government of Brooklyn were the wealthy land owners in Brooklyn , and they made sure the government was ran how they wanted it to be and everything favored them. And as far as documentation goes we think that population, jobs, money, buildings, were some of the collected things with the exception of the slave population.
I usually check up on my posts, and I just noticed that I mistakenly attached the wrong file for my second library/archive report. Please pardon my mistake. Please click on the link to view my second library/archive report:
CopyofLearningPlacesLibraryArchiveReport-2
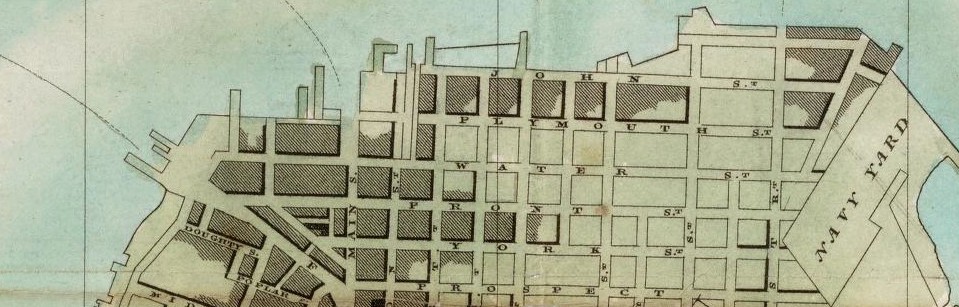
The time frame that my research is generally within is between the 1920s and 1960s. A number of my primary sources are maps and texts, such as the Brooklyn Daily Eagle newspaper archives; and many other secondary sources are also maps and text, such as articles found online. The Robert Moses website will provide many of the leads for locating governmental agencies involved in the city planning, finding documents and recorded information, and understanding political motives. The focus of my research is on Hudson Avenue, particularly the motive behind the urban renewal that caused it to be altered from the original construction. The context of my research is aimed at the point where Hudson Avenue intersects York Street. There were many major technological developments during the 1920s and 1960s, such as the radio and automobile. Aerial photography was used in surveying the landscape of Brooklyn. This timeframe also was just after World War I and enveloped World War II, which played a major role in the industry and urbanization of Brooklyn. The Navy Yard was utilized primarily for the wartime efforts. This also played a major role in the development of Vinegar Hill. Robert Moses and Mayor Laguardia, along with other influential agencies, played an important role in the development of Brooklyn and the relationships with nearby localities. There are many documents that can be retrieved from archives or online from governmental public records that can assist me with my research project. Knowing and understanding the contexts (primarily political and economic) for all of the urban development and renewal is a major aspect of truly capturing the accuracy of my research project.
The OpenLab is an open-source, digital platform designed to support teaching and learning at City Tech (New York City College of Technology), and to promote student and faculty engagement in the intellectual and social life of the college community.

