Exam #2: Take-home exam due Sunday, May 3

Exam #2 is a take-home exam due Sunday; I have uploaded the pdf to Files. We also discussed some of the exam questions at the end of today’s Blackboard Collaborate class session.

As with the recent Quiz #3 and HW8, write out your solutions and submit them via Blackboard-Assignments, preferably as a single pdf file.

You will also need to submit a spreadsheet for the last exercise on the exam. As I wrote on the exam, you can either submit the spreadsheet as an additional attachment with your pdf, or you can copy/paste the share link as a comment when you submit your written solution.

Email me if you have any questions about the exam, or about related examples or exercises! I will have office hours Thursday and Friday via Blackboard Collaborate for questions (times TBA tomorrow morning).

Notes on Mon April 27 Blackboard Session / Exam #2 Announcement

On Monday we discussed the following topics:

  • 1st 30mins: we discussed the upcoming schedule of HWs and related OpenLab posts, and I announced the plan for Exam #2
    • Exam #2 will be a take-home (open book) exam which I will post later today, and will be due Sunday
    • Please join the Blackboard Collaborate session coming up today at 12p, when I will give a preview of the exam questions!
  • 30min-1h20m: we went through some examples of constructing and graphing the probability distribution of a random variables; in particular for the random variables/probability experiments of
    • X = number of heads observed when flipping a coin 3 times;
    • X = sum of two 6-sided  dice
  • 1h20m – 1h45m: we calculated the expected value E[X] of a random variable from its probability distribution

An Introduction to Bayes Theorem (including videos!)

We needed to use Bayes’ Theorem to solve HW7 #2. In this post, I try to briefly address the following questions:

  • What is Bayes’ Theorem?
  • Where does it come from?
  • What is the “Bayesian interpretation” of probability?
  • Why is called “Bayes'”  Theorem?

Also, at the bottom of the post are a handful of videos regarding Bayes Theorem (including applications to medical testing!), and links to a couple books entirely about Bayesian probability.

What is Bayes’ Theorem?

Bayes’ Theorem (or Bayes’ Rule) is following formula for computing conditional probability (screenshot taken from https://en.wikipedia.org/wiki/Bayes%27_theorem#Statement_of_theorem):

Bayes Theorem

Where does Bayes’ Theorem come from?

Where does formula above for P(A | B) come from?  We just have to do some algebra on the definition of conditional probability.

Start with the definition of conditional probability, applied to P(A | B) and P(B | A):

P(A | B) = P(A & B)/P(B)

P(B | A) = P(A & B)/P(A)

Now “clear the denominators” on the RHS of each equation by multiplying thru by P(B) and P(A), respectively:

P(A | B) * P(B) = P(A & B)

P(B | A) * P(A) = P(A & B)

Since the RHS is in both these equations, we know the two LHS of the equations are equal to each other!

P(A | B) = P(B | A) * P(A)/P(B)

Now just divide through by P(B) and we get Bayes’ Rule:

P(A | B) * P(B) = P(B | A) * P(A)


What is the “Bayesian interpretation” of probability?

Also from the wikipedia entry for Bayes’ Theorem

Bayesian Interpretation

See the wikipedia entry for Bayesian probability for more on this!


Why is it called Bayes’ Rule?

One more quote from the wikipedia entry for Bayes’ Theorem:

Bayes’ theorem is named after Reverend Thomas Bayes (/bz/; 1701?–1761), who first used conditional probability to provide an algorithm (his Proposition 9) that uses evidence to calculate limits on an unknown parameter, published as An Essay towards solving a Problem in the Doctrine of Chances (1763). In what he called a scholium, Bayes extended his algorithm to any unknown prior cause. Independently of Bayes, Pierre-Simon Laplace in 1774, and later in his 1812 Théorie analytique des probabilités, used conditional probability to formulate the relation of an updated posterior probability from a prior probability, given evidence. Sir Harold Jeffreys put Bayes’s algorithm and Laplace’s formulation on an axiomatic basis. Jeffreys wrote that Bayes’ theorem “is to the theory of probability what the Pythagorean theorem is to geometry.”


Videos on Bayes Theorem:

Here are two introductions to Bayes Theorem:


An important application of Bayes Theorem is accuracy of medical tests–this is very timely since there is a lot of discussion about the accuracy of coronavirus testing!  Here are two videos specifically on that topic:


Textbooks on Bayesian :

If you want to go even further, there are entire books devoted to Bayesian probability/statistics. Here are two introductory textbooks that look interesting (in fact, I hope to read them myself at some point!):

HW7 #2 (using Bayes’ Rule)

Here is a snapshot of Exercise #2 on HW7-ConditionalProbability:

HW7-2

The first step with this exercise is to write down the given probabilities in terms of events that we can call:

W = neighbor waters the plant

D = plant dies

So we are given the following in the statement of the problem:

P( D | W ) = 0.5 (and so P( not D | W  ) = 1 – 0.5 = 0.5)

P( D | not W ) = 0.85 (and so P( not D | W ) = 1 – 0.85 = 0.15)

Also we are given P(W) = 0.83 (and so P(not W) = 1 – 0.83 = 0.17)

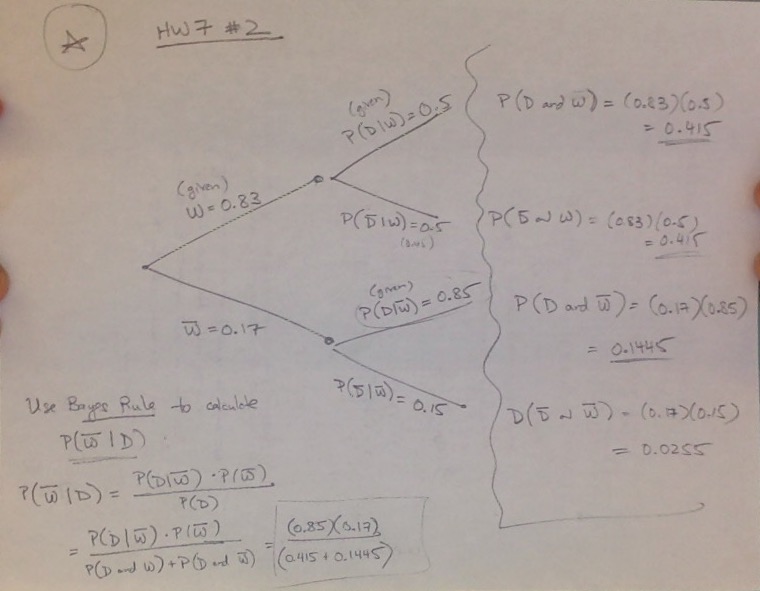
We can arrange these into a tree diagram, and also use the Multiplication Rule along the branches of the tree to compute the “joint probabilities”:

P(W & D) =  P(W) * P(D | W) = (0.83)(0.5) = 0.415

P(W & not D) = P(W) * P(not D | W) = (0.83)(0.5) = 0.415

P(not W & D) = P(not W) * P(D | not W) = (0.17)(0.85) = 0.1445

P(not W & not D) = P(not W) * P(not D | not W) = (0.17)(0.15) = 0.0255

(Note that these four add up to 1, as they should, since these 4 combinations cover the 4 possible outcomes! You can think of this as a probability distribution over these 4 possible outcomes.)

A tricky part of this question is interpreting what probability the question is asking for. It turns out that “What is the probability that the plant died because neighbor forgot to water it?” corresponds to P(not W | D)!

In order to compute this probability from the given probabilities, we need to apply what’s called Bayes’ Theorem, which comes from the definition of conditional probability.

(See this post for a longer introduction to Bayes’ Theorem, including its algebraic derivation from the definition of conditional probability.)

Here is a statement of Bayes’ Theorem, taken from https://en.wikipedia.org/wiki/Bayes%27_theorem#Statement_of_theorem:

Bayes Theorem

We can apply Bayes’ Theorem this to compute P(not W | D); here is the tree diagram and the calculation of P(not W | D) (in the bottom left part of the page):

HW7 #2: Solution

Exercise: Probability Distribution (X = sum of two 6-sided dice)

We have previously discussed the probability experiment of rolling two 6-sided dice and its sample space.  Now we can look at random variables based on this probability experiment. A natural random variable to consider is:

X = sum of the two dice

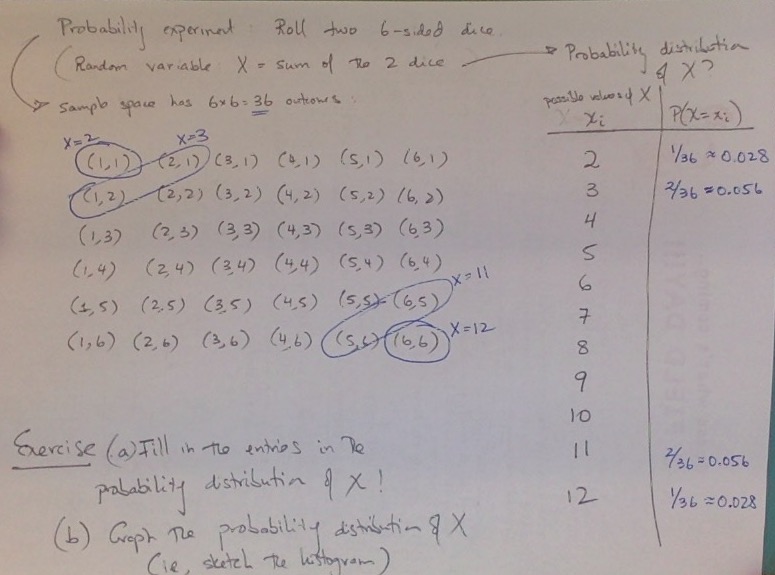
You will construct the probability distribution of this random variable. For reference, I wrote out the sample space and set up the probability distribution of X; see the snapshot below.

It will be a exam exercise to complete the probability distribution (i.e., fill in the entries in the table below) and to graph the probability distribution (i.e., as a histogram):

Sample space of rolling two 6-sided dice

Notes for Mon April 20 / HW8 (Permutations & Combinations)

Here’s a brief recap of today’s Blackboard Collaborate session:

For the first approximately 40mins, we gave an overview of HW8, which consists of permutations and combinations calculations:

  • HW8 is a written homework assignment; you can find the pdf with the homework exercises under Files
    • HW8 is due next Monday (April 27)
    • I will create an Assignment in Blackboard where you can submit your solutions (preferably as a pdf, as you did for Quiz #3 over the weekend)
    • we went through HW8 #1 together–in particular I wanted to demonstrate how to show your work;
    • we will go through at least one more exercise from HW8 during Wednesday’s Blackboard session

We spent the remaining hour reviewing random variables and introducing probability distributions for such random variables.

Please review the Class Outline on those topics–in particular, it’s essential you understand the example involving the probability experiment of flipping a coin 3 times, and constructing the probability distribution for the random variable “X = the number of heads observed.”  We will build on that example when we discuss binomial experiments and binomial random variables.

You can review the Blackboard recording, and/or you can view this Khan Academy  video, which constructs the probability distribution for that same random variable:


Quiz #3: Take-home quiz due Sunday

Quiz #3 is a take-home quiz due Sunday; I uploaded the pdf to Files yesterday, and also discussed it during yesterday’s Blackboard Collaborate class session.

It could be useful to review yesterday’s Blackboard Collaborate recording and/or Exam #1, since the quiz is about the probability experiment of flipping a coin 4 times in a row. During the Blackboard class session we discussed the similar experiment of flipping a coin 3 times in a row. There was also an exercise about it on Exam #1.

As I discussed, if you have access to a printer you can print out the quiz and write your solutions on that. Alternatively, you can write your solutions on separate pieces of paper. You don’t have to rewrite the statements of the exercises, but please number your solutions and write them in order (i.e., from #1 – #5).

After you have completed writing out your solutions:

  • scan your solutions to a pdf file using your phone or a tablet
    • there are a number of free apps that will allow you to scan to a pdf, such Adobe Scan or Genius Scan (those two plus a few others are discussed in this tech review)
    • if you have the Google Drive app on your phone, you can use that to scan to a pdf that will be uploaded to your Google Drive
  • upload the pdf to Blackboard: I have created a Blackboard Assignment for this quiz where you can submit your pdf
    • go to the “Content” section to find the assignment and submit by attaching your pdf.

Email me if you have any questions! I will also have office hours tomorrow via Blackboard Collaborate if you have questions.

Videos/Notes for Wed April 15: Discrete Random Variables

We introduced (discrete) random variables during our Blackboard Collaborate session today.  We went over the 1st page of the class outline on this topic (available in Files as “Class Outline – Day 17”).  We also discussed Quiz #3, which has also been uploaded to the Files. It is due Sunday (April 19). Instructions for submitting your solutions will be posted later today.

We watched the beginning of the following jbstatistics video introducing discrete random variables. We will continue with this topic next Monday, but I recommend watching the entire video to get a preview:


Videos/Notes for Tues April 7: Permutations and Combinations

See below for some videos and notes recapping our Tuesday April 7 class session:

  • we spent most the session going through the class outline on “Permutations and Combinations“; please review the outline and try to write out solutions to the Example exercises (I will collect these exercises plus some additional exercises as a homework set; details TBA!)


  • Here are a few YouTube videos by a math teacher whose videos I like (Patrick JMT):
    • see the following video which discusses permutations:


    • we only introduced combinations at the end of the session; we will pick up with that topic next Monday, but in the meantime viewing this video may help:

    • this video is also relevant–please watch it:

  • Finally, I haven’t watched thru this entire video yet (it’s longer, 38mins), but it looks pretty good, and addresses one of the key questions–what is the difference between permutations and combinations?

WebWork Hints: Conditional Probability (HW6 & HW7)

Here are recaps of the WebWork exercises we went over in the Blackboard Collaborate class session earlier today (remember that you can view the recording of the BB Collaborate session at https://us-lti.bbcollab.com/recording/dda6c10a1bf645ac99623a8f9549af40).

(If you catch any errors in my solutions below, please let me know!)

HW6:

#16: We went over #16 first–it helps to understand these tree diagrams before doing #15 (below).

Here’s the tree diagram from#16 (the probabilities on your tree may be different):
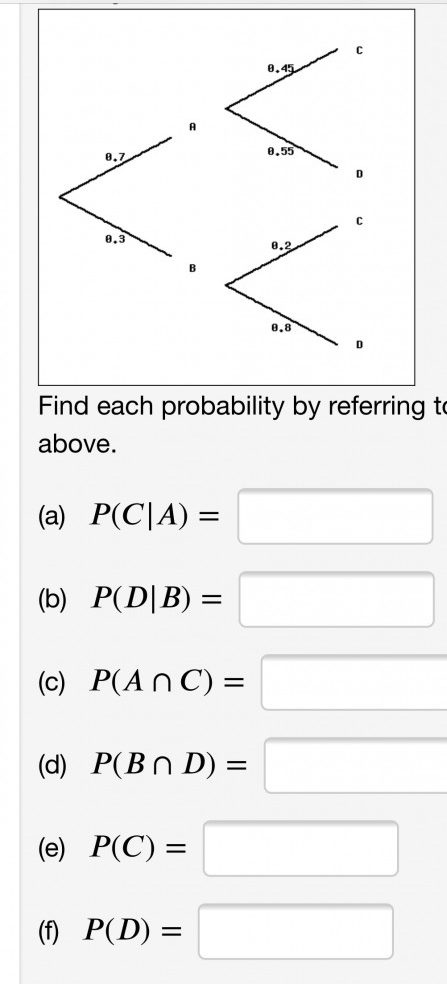
As we discussed, the tree diagram shows various probabilities for a certain probability experiment, which you can think of as two sequential coin flips:

  • the first coin flip comes up as A or B, with probabilities 0.7 and 0.3, respectively (think of this as a weighted coin!)
  • the second coin flip comes up as C or D–but the probabilities depend on whether the first coin flip came up A or B!
    • in particular, the conditional probability P(C|A) means the probability of C given that A has occurred, i.e., P(C|A) is the number attached to the branch that leads to C from A.  Thus, in this example, P(C|A) = 0.45.
    • Similarly, you can read off P(D|A), P(C|B) and P(D|B) directly from the tree diagram: 0.55, 0.2, and 0.8 respectively.
    • You can compute probabilities such P(AC) and P(BD) by using the Multiplication Rule. If we write it out for P(AC):
      • P(AC) = P(A)*P(C|A) = 0.7*0.45, i.e., we just multiply the probabilities along the path through the tree that leads to C via A!
    • Finally, to compute P(C), add up the probabilities of the two different paths that lead to the outcome C, i.e., via A or via B:
      • P(C) = P(AC) + P(BC) = 0.7*0.45 + 0.3*0.2


#15:

Note the hint at the bottom: draw a tree diagram, like the one we saw in #16!

The probability experiment here involves choosing a randomly selected person over 40. But if you look at the questions you’re asked in (a), (b), (c), we can interpret the two “coin flips” upon selecting a person as

(1) does that person have diabetes or not; and

(2) is that person diagnosed as having diabetes or not (we can call these two outcomes as “testing positive” or “testing negative”)

Here’s a snapshot of the tree diagram I drew, with probabilities pulled from the percentages given in the statement of the exercise:
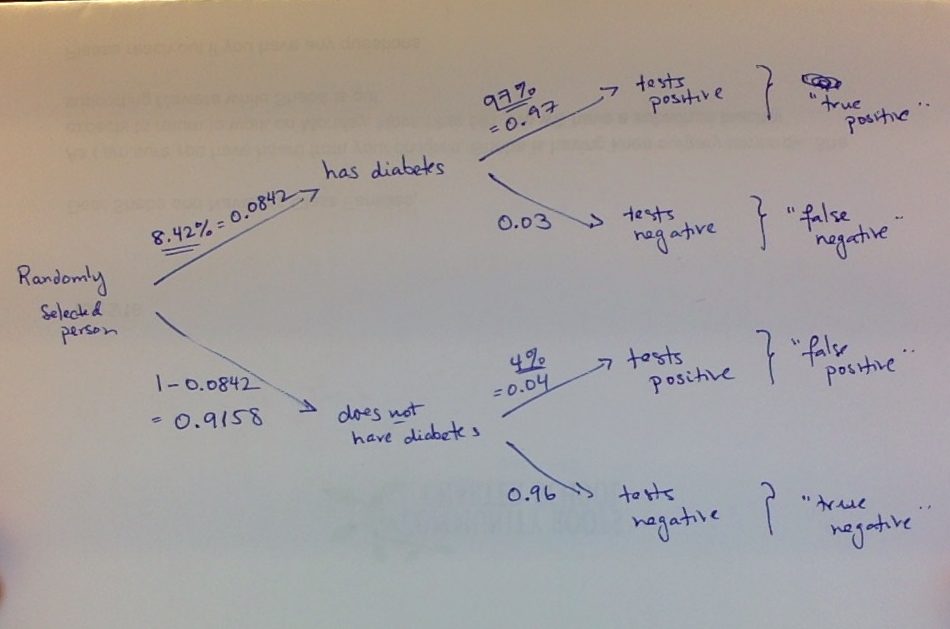
Note that I got the underlined percentages/probabilities directly from the statement of the exercise, and calculated the other ones by subtraction from 1 (e.g., we are told that 8.42% of Americans have diabetes, so 100% – 8.42% = 91.58% do not have diabetes. These are the two probabilities shown on the “first branch”–whether the randomly selected person has diabetes or not.)

Now we can just calculate the answers from this tree (as we did for #16):

a) the probability of a false positive, i.e., P( “does not have diabetes” & “tests positive”) is the product of the probabilities along that branch:

P( “does not have diabetes” & “tests positive”)= (0.9158)(0.04)

b) To find the probability that a randomly selected adult of 40 is diagnosed as not having diabetes, i.e., P(“tests negative”), we need to add together the probabilities of travelling along the two paths that lead to that outcome (i.e., (1) has diabetes & tests negative + (2) does not have diabetes & tests negative):

P(“tests negative”) = P(“has diabetes” & “tests negative”) + P(“does not have diabetes” & “tests negative”) =  (0.9158)(0.96) + (0.0842)(0.03)

[you should see how these numbers come from following the paths!]

(c) is trickier: note that the words “given that” mean we have to calculate the following conditional probability: P(“has diabetes” | “tests negative”)

By the definition of conditional probability:

P(“has diabetes” | “tests negative”) =

P(“has diabetes” & “tests negative”) / P(“tests negative”)

We get the numerator from multiplying the probabilities along that path:

P(“has diabetes” & “tests negative”) = (0.0842)(0.03)

and we already calculated the denominator in (b)!

So

P(“has diabetes” | “tests negative”) =

P(“has diabetes” & “tests negative”) / P(“tests negative”) =

(0.0842)(0.03)/[(0.9158)(0.96) + (0.0842)(0.03)]


HW7:

#1: This is similar to #16 from HW6! See the solutions above.

#3: The statement of  the exercise reads: “Two cards are drawn from a regular deck of 52 cards, without replacement. What is the probability that the first card is an ace of clubs and the second is black?”

This is an application of conditional probability and the Multiplication Rule. First, recall that “without replacement” means that after drawing the 1st card, you don’t put it back it in the deck–so you’re sample space for the 2nd draw is reduced to 51 cards.

We need to calculate the probability

P( “1st card is ace of clubs” & “2nd card black”) =

P(“1st card ace of clubs”) * P(“2nd card black”| “1st card is ace of clubs”) =

(1/52)*(25/51)

Note that the P(“2nd card black”| “1st card is ace of clubs”) = 25/51 because the sample space is reduced to the remaining 51 cards, and of those only 25 are black (b/c we are assuming the 1st card drawn was the ace of clubs, which is black).

Also note that we can do a rough estimation of this probability, as follows:

1/52 ≈ 0.02 (actually slightly less than 0.02, since 1/50 = 0.02) and

25/51 ≈ 1/2 (actually slightly less than 1/2, since 25/50 = 1/2)

so (1/52)*(25/51) ≈ 0.02*(1/2) = 0.01

So we can estimate that the probability of drawing an ace of clubs and then a black card is less than 0.01, i.e., less than 1%.

(Using a calculator, the exact value is

(1/52)*(25/51) = 25/(52*51) = 0.00942684766214178, i.e., 0.942.. %)

#6: My statement of the exercise reads “Of 380 male and 220 female employees at the Flagstaff Mall, 250 of the men and 130 of the women are on flex-time (flexible working hours). Given that an employee selected at random from this group is on flex-time, what is the probability that the employee is a woman? ”

This is a straightforward conditional probability calcuation; you are being asked to calculate P(“woman”|”flex-time”); the “reduced sample space” for calculating this conditional probability is the number of flex-time employees, which in this example is 250+130 = 380. The number of women in this reduced sample space is 130 (the number of women on flex-time).

Hence,

P(“woman”|”flex-time”) = 130/280 = 13/28.

If you want to apply the formula for conditional probability, you can get to the solution that way. Actually it is instructive to see how that works:

P(“woman”|”flex-time”) = P(“woman” & “flex-time”)/P(“flex-time”)  = (130/600)/(280/600) = (130/600)*(600/280) = 130/280.

Note that the probabilities here are relative to the original sample space of 380+220 = 600 total employees, which is why that is in the denominators for P(“woman” & “flex-time”) and P(“flex-time”); but when we do the division, those terms cancel out!


#7: You are given the values of P(E∩F), P(E|F) and P(F|E).  To calculate P(E) and P(F) from these values, recall the formula for the conditional probabilities:

(1) P(E|F) = P(E∩F)/P(F)

(2) P(F|E) = P(E∩F)/P(E)

If you solve these equations for P(F) and P(E) respectively, you get:

(1a) P(F) = P(E∩F)/P(E|F)

(2a) P(E) = P(E∩F)/P(E|F)

[You should understand the algebra for getting from (1) to (1a), and from (2) to (2a)! It’s pretty simple algebra–it’s just solving x = y/z for z, i.e., z = y/x.]

Now you can use (1a) and (2a) to calculate P(F) and P(E).

Then you can solve for P(E∪F) using the Addition Rule:

P(E∪F) = P(E) + P(F) – P(E∩F)