Here are recaps of the WebWork exercises we went over in the Blackboard Collaborate class session earlier today (remember that you can view the recording of the BB Collaborate session at https://us-lti.bbcollab.com/recording/dda6c10a1bf645ac99623a8f9549af40).
(If you catch any errors in my solutions below, please let me know!)
HW6:
#16: We went over #16 first–it helps to understand these tree diagrams before doing #15 (below).
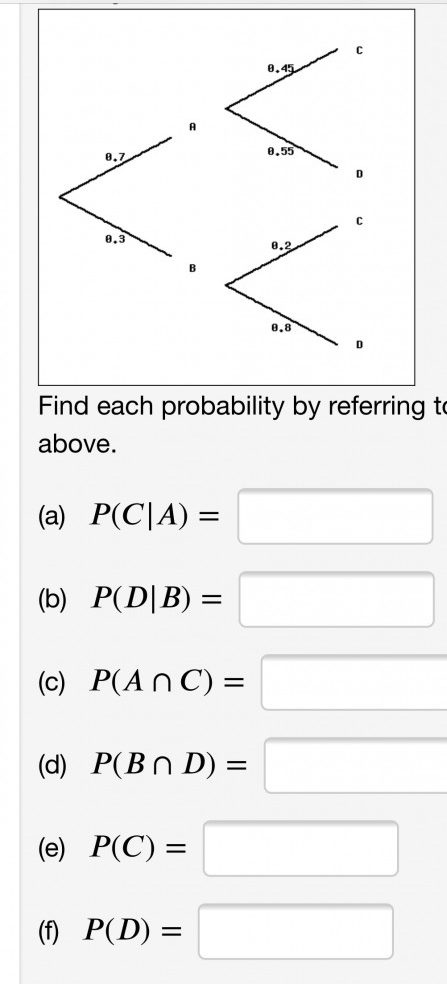
Here’s the tree diagram from#16 (the probabilities on your tree may be different):

As we discussed, the tree diagram shows various probabilities for a certain probability experiment, which you can think of as two sequential coin flips:
- the first coin flip comes up as A or B, with probabilities 0.7 and 0.3, respectively (think of this as a weighted coin!)
- the second coin flip comes up as C or D–but the probabilities depend on whether the first coin flip came up A or B!
- in particular, the conditional probability P(C|A) means the probability of C given that A has occurred, i.e., P(C|A) is the number attached to the branch that leads to C from A. Thus, in this example, P(C|A) = 0.45.
- Similarly, you can read off P(D|A), P(C|B) and P(D|B) directly from the tree diagram: 0.55, 0.2, and 0.8 respectively.
- You can compute probabilities such P(A∩C) and P(B∩D) by using the Multiplication Rule. If we write it out for P(A∩C):
- P(A∩C) = P(A)*P(C|A) = 0.7*0.45, i.e., we just multiply the probabilities along the path through the tree that leads to C via A!
- Finally, to compute P(C), add up the probabilities of the two different paths that lead to the outcome C, i.e., via A or via B:
- P(C) = P(A∩C) + P(B∩C) = 0.7*0.45 + 0.3*0.2
#15:

Note the hint at the bottom: draw a tree diagram, like the one we saw in #16!
The probability experiment here involves choosing a randomly selected person over 40. But if you look at the questions you’re asked in (a), (b), (c), we can interpret the two “coin flips” upon selecting a person as
(1) does that person have diabetes or not; and
(2) is that person diagnosed as having diabetes or not (we can call these two outcomes as “testing positive” or “testing negative”)
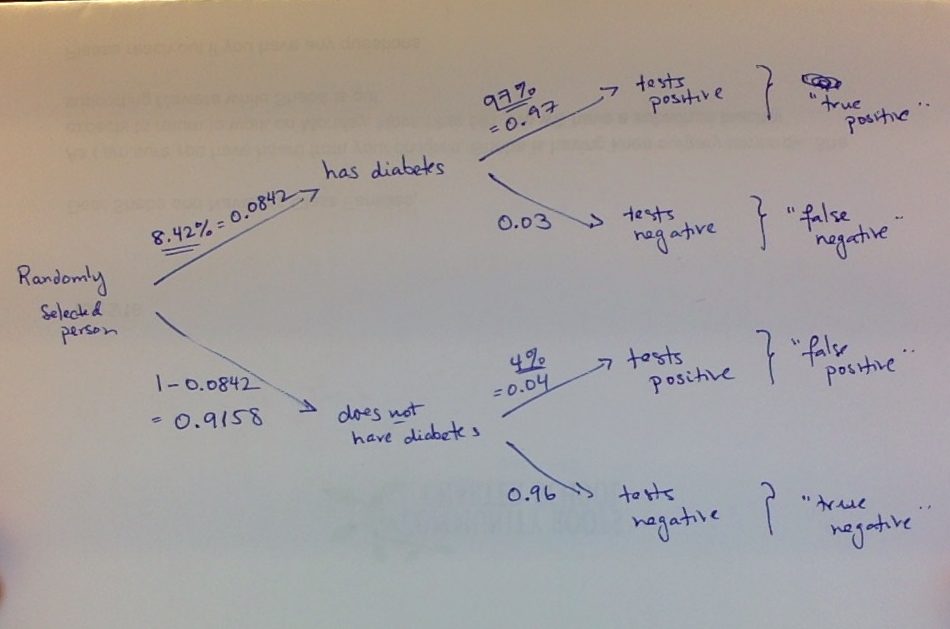
Here’s a snapshot of the tree diagram I drew, with probabilities pulled from the percentages given in the statement of the exercise:

Note that I got the underlined percentages/probabilities directly from the statement of the exercise, and calculated the other ones by subtraction from 1 (e.g., we are told that 8.42% of Americans have diabetes, so 100% – 8.42% = 91.58% do not have diabetes. These are the two probabilities shown on the “first branch”–whether the randomly selected person has diabetes or not.)
Now we can just calculate the answers from this tree (as we did for #16):
a) the probability of a false positive, i.e., P( “does not have diabetes” & “tests positive”) is the product of the probabilities along that branch:
P( “does not have diabetes” & “tests positive”)= (0.9158)(0.04)
b) To find the probability that a randomly selected adult of 40 is diagnosed as not having diabetes, i.e., P(“tests negative”), we need to add together the probabilities of travelling along the two paths that lead to that outcome (i.e., (1) has diabetes & tests negative + (2) does not have diabetes & tests negative):
P(“tests negative”) = P(“has diabetes” & “tests negative”) + P(“does not have diabetes” & “tests negative”) = (0.9158)(0.96) + (0.0842)(0.03)
[you should see how these numbers come from following the paths!]
(c) is trickier: note that the words “given that” mean we have to calculate the following conditional probability: P(“has diabetes” | “tests negative”)
By the definition of conditional probability:
P(“has diabetes” | “tests negative”) =
P(“has diabetes” & “tests negative”) / P(“tests negative”)
We get the numerator from multiplying the probabilities along that path:
P(“has diabetes” & “tests negative”) = (0.0842)(0.03)
and we already calculated the denominator in (b)!
So
P(“has diabetes” | “tests negative”) =
P(“has diabetes” & “tests negative”) / P(“tests negative”) =
(0.0842)(0.03)/[(0.9158)(0.96) + (0.0842)(0.03)]
HW7:
#1: This is similar to #16 from HW6! See the solutions above.
#3: The statement of the exercise reads: “Two cards are drawn from a regular deck of 52 cards, without replacement. What is the probability that the first card is an ace of clubs and the second is black?”
This is an application of conditional probability and the Multiplication Rule. First, recall that “without replacement” means that after drawing the 1st card, you don’t put it back it in the deck–so you’re sample space for the 2nd draw is reduced to 51 cards.
We need to calculate the probability
P( “1st card is ace of clubs” & “2nd card black”) =
P(“1st card ace of clubs”) * P(“2nd card black”| “1st card is ace of clubs”) =
(1/52)*(25/51)
Note that the P(“2nd card black”| “1st card is ace of clubs”) = 25/51 because the sample space is reduced to the remaining 51 cards, and of those only 25 are black (b/c we are assuming the 1st card drawn was the ace of clubs, which is black).
Also note that we can do a rough estimation of this probability, as follows:
1/52 ≈ 0.02 (actually slightly less than 0.02, since 1/50 = 0.02) and
25/51 ≈ 1/2 (actually slightly less than 1/2, since 25/50 = 1/2)
so (1/52)*(25/51) ≈ 0.02*(1/2) = 0.01
So we can estimate that the probability of drawing an ace of clubs and then a black card is less than 0.01, i.e., less than 1%.
(Using a calculator, the exact value is
(1/52)*(25/51) = 25/(52*51) = 0.00942684766214178, i.e., 0.942.. %)
#6: My statement of the exercise reads “Of 380 male and 220 female employees at the Flagstaff Mall, 250 of the men and 130 of the women are on flex-time (flexible working hours). Given that an employee selected at random from this group is on flex-time, what is the probability that the employee is a woman? ”
This is a straightforward conditional probability calcuation; you are being asked to calculate P(“woman”|”flex-time”); the “reduced sample space” for calculating this conditional probability is the number of flex-time employees, which in this example is 250+130 = 380. The number of women in this reduced sample space is 130 (the number of women on flex-time).
Hence,
P(“woman”|”flex-time”) = 130/280 = 13/28.
If you want to apply the formula for conditional probability, you can get to the solution that way. Actually it is instructive to see how that works:
P(“woman”|”flex-time”) = P(“woman” & “flex-time”)/P(“flex-time”) = (130/600)/(280/600) = (130/600)*(600/280) = 130/280.
Note that the probabilities here are relative to the original sample space of 380+220 = 600 total employees, which is why that is in the denominators for P(“woman” & “flex-time”) and P(“flex-time”); but when we do the division, those terms cancel out!
#7: You are given the values of P(E∩F), P(E|F) and P(F|E). To calculate P(E) and P(F) from these values, recall the formula for the conditional probabilities:
(1) P(E|F) = P(E∩F)/P(F)
(2) P(F|E) = P(E∩F)/P(E)
If you solve these equations for P(F) and P(E) respectively, you get:
(1a) P(F) = P(E∩F)/P(E|F)
(2a) P(E) = P(E∩F)/P(E|F)
[You should understand the algebra for getting from (1) to (1a), and from (2) to (2a)! It’s pretty simple algebra–it’s just solving x = y/z for z, i.e., z = y/x.]
Now you can use (1a) and (2a) to calculate P(F) and P(E).
Then you can solve for P(E∪F) using the Addition Rule:
P(E∪F) = P(E) + P(F) – P(E∩F)


