Tag Archives: inquiry

Enzyme Kinetics (activity)

The Enzyme

Amylase reaction
Amylase is an enzyme that breaks down amylose (starch) into glucose molecules.

      1. What test can be used to indicate the presence of Starch?
      2. What test can be used to indicate the presence of glucose?
      3. What is the role of an enzyme in a chemical reaction and what is it made of?
      4. What parameters would influence the ability of the enzyme to facilitate the rate of the reaction?
salivary_amylase
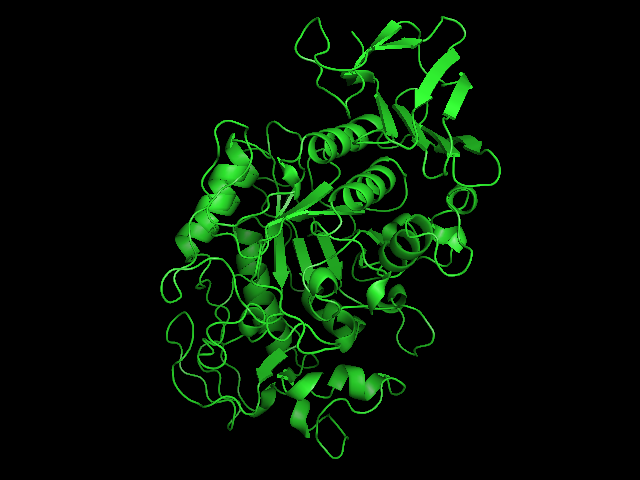
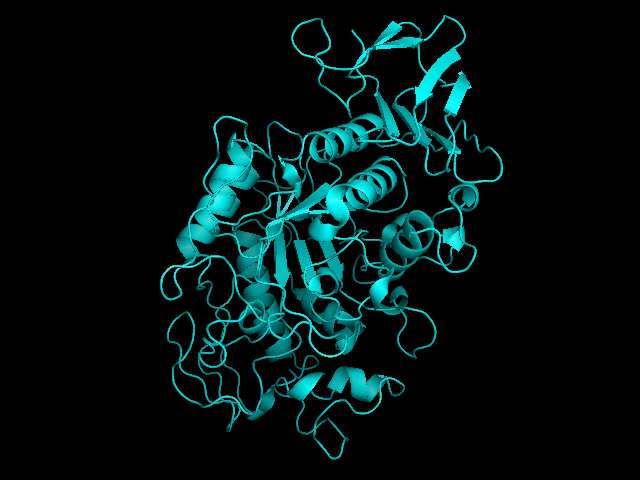
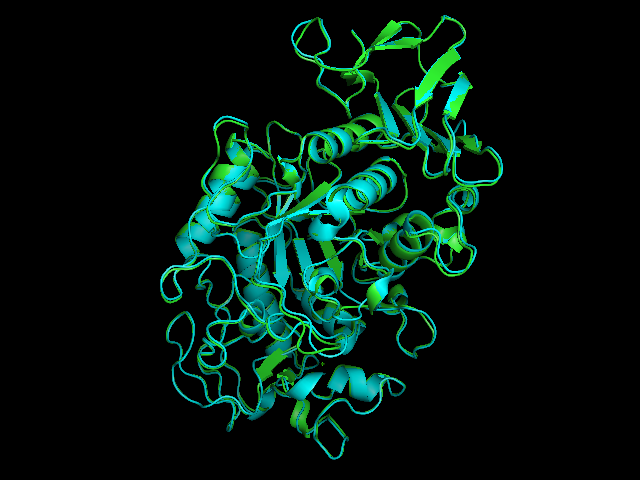
Salivary amylase is produced in the mouth, where digestion begins.
pancreatic_amylase
Pancreatic amylase is produced in the pancreas and is supplied to the duodenum of the small intestines.
amylase_overlay
Overlay of salivary (green) and pancreatic (teal) amylase molecules.


Tags: , , ,

Quantitative Skills

Variables

Experimental science looks at cause and effect types of relationships. Controlled experiments vary one of the factors or traits  to observe the effect on another factor or trait. These factors are called variables. A dependent variable is something that is observed and expected to change as a result of modifying another factor in the experiment. That is to say, the outcome depends on another factor. The independent variable is the factor or condition that is changing or being changed by the experimenter. Sometimes waiting is the the condition that is changing, making the independent variable: time.
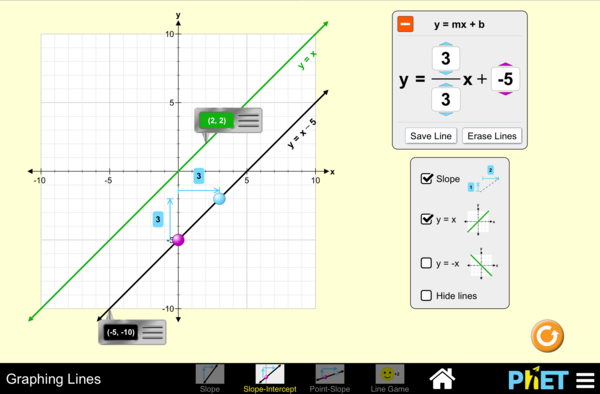
Graphing a line

Linear Function Graph
A graph displaying 2 lines and their equations

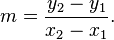
 A line can be described mathematically by the equation:

y = mx + b
This is referred to as the slope-intercept form. The 2 variables y and x refer to coordinates along each axis. The term m refers to the change in the y-values over the change in the x-values. This is referred to as the slope of the line. The term b, the y-intercept, is the y-value where the line crosses the y-axis.
slope
This is how the slope of a line (m) is determined.

The slope of the line indicates the relationship between the two variables, x and y. The equation of the line y=mx+b indicates to us that “y” occurs as a function of changes to “x”. Sometimes this is represented by the equation f(x)=mx+b . Since “y” depends on “x”, “y is the dependent variable and “x” is the independent variable.  As “x” changes, how does “y” change in response? This is what the slope reveals to us.

For more review, visit the following link.

Slope activity


Graphing Lines
Click on image to run the simulation

 Data Plotting Activity

  1. Use the following data from the USDA to plot a scatterplot and generate a trend-line.
      • Use the info from the table below or download (a text file that can be opened in notepad/textedit)
      • follow a tutorial on how to graph a scatterplot with line of best fit (trend-line)
      • or use this tutorial in plot.ly

    • remember NOT to make a line graph
  2. Ensure that “Year” is the x-axis
  3. Ensure that “lbs. Mozzarella” is the y-axis
  4. Show the equation of the trend-line on the graph
Year lbs. Mozzarella
2000 9.33
2001 9.70
2002 9.66
2003 9.65
2004 9.94
2005 10.19
2006 10.52
2007 11.02
2008 10.57
2009 10.63

What do we learn?

  1. What does this scatterplot tell us about the relationship between consumption of mozzarella in relationship to years?
  2. How would this graph influence the way you invest in a mozzarella cheese company? Can you predict anything about the future of cheese consumption?
  3. What does the slope of this line indicate to you?
    1. Use mathematics to illustrate this point.
    2. The slope has a unit related to “lbs.” and “year”, what is this unit?


Tags: , , ,

Why are cells small? (activity)

Why are cells so small?

  1. Take 3 blocks of agar of different size (1cm, 2cm, 3cm) → these are our cell models
  2. Measure the length, width and height of each cube using a ruler
  3. Calculate the area of each face of the cubes and add all the areas together for a single cube
    • a cube has 6 faces → the total surface area is the same as the area of one side multiplied by 6
  1. Calculate the volume of each cube
  2. Report the surface area-to-volume in the table below

Data Table: Calculating Surface Area-to-Volume Ratio

Cell Model (cube)

Length

Width

Height

Total Surface Area

Volume of cell

Surface Area: Volume

1

2

3

Stop and think:

  • Which cube has the greatest surface area:volume ratio?
  • Which cube has the smallest surface area:volume ratio?
  • Hypothesize: In an osmosis or diffusion experiment, which cube size would have the greatest diffusion rate?


Procedures:

  1. Each group will cut three agar cubes: A 3cm cube, a 2cm cube, and a 1cm cube. CUT AS ACCURATELY AS POSSIBLE. (This may be already completed for you.)
  2. Pour 200mL of 0.1M NaOH into your plastic cup.
  3. Immerse your 3 cubes in the NaOH, noting the time.
  4. Let the cubes soak for approximately 10 minutes.
  5. Periodically, gently stir the solution, or turn the cubes over.
  6. After 10 minutes, remove the diffusion solution
  7. Blot the cubes with a paper towel.
  8. Promptly cut each cube in half and measure the depth to which the pink color has penetrated. Sketch each block’s cross-section.
  9. Record the volume that has remained white in color.
  10. Do the following calculations for each cube and complete the following data table:

Data Table: Calculation of Diffusion Area-to-Volume

Cube Size

Cube volume (cm3)

Vtotal

Volume white

(cm3)

Vwhite

Sketch of each

Cube

Volume of the diffused cube

( Vtotal – white)

Vdiffused

Percent Diffusion
(Vdiffused/Vtotal)

Surface Area: Volume

(from previous table)

1cm
2cm
3cm

Conclude:

  • Which cube had the greatest percentage of diffusion?
  • Did this meet your expectations with your hypothesis?
  • If you designed a large cell, would it be a large sphere or something long and flat?

Tags: , , ,

Gummy Bears: Tonicity (Activity)

Activity: What makes my Gummy Bear swell faster?

We’re all familiar with gelatin (like the Jello brand). Gummy candies are are made of gelatin. Gelatin is a protein that exists as long fibers. When gelatin is dissolved in a liquid and cooled, the gelatin fibers tangle together in a mesh-like network. The space in between the gelatin molecules is filled with the fluid it was dissolved in. Gummy candies are considerably more firm than the gelatin molds we have as desserts because they contain a lot less fluid. Nonetheless, gummy candies are filled with a sugary solution with coloring. Like a cell, a gummy candy placed in solution will be affected by the properties of osmosis when submerged in different solutions.

Stop and think

  • Is distilled water hypertonic, hypotonic or isotonic compared to the sugar solution inside a gummy candy?
  • Based on your answer, hypothesize if a gummy candy submerged in distilled water or 40% salt solution will swell faster? Label the diagram below with your hypothesis.

Procedures

  1. Obtain 2 gummy bears and place them in 2 different small flasks.
  2. Drown 1 bear in distilled water and drown the other in 40% salt solution.
  3. At the end of the lab session, remove the bears from solution and document the size difference with your mobile phone.

gummybear-osmosis

Hypothesized swelling of the bear based on tonicity

Condition

Tonicity
Inside Bear Relative to the Solution

Tonicity
Outside relative to the Bear

Hypothesis
about swelling

A

B


Tags: , ,