Contents
Writing the Rules of Heredity
 In the mid 1800’s, an Augustinian friar named Gregor Mendel formalized quantitative observations on heredity in the the pea plant. He undertook hybridization experiments that utilized purebred or true breeding plants with specific qualities over many generations to observe the passage of these traits. Some of these physical traits included: seed shape, flower color, plant height and pod shape.


The loss of one variant on the trait in the F1 plants with the re-emergence in the F2 prompted Mendel to propose that each individual contained 2 hereditary particles where each offspring would inherit 1 of these particles from each parent. Furthermore, the loss of one of the variants in the F1 was explained by one variant masking the other, as he explained as being dominant. The re-emergence of the masked variation , or recessive trait in the next generation was due to the both particles being of the masked variety. We now refer to these hereditary particles as genes and the variants of the traits as alleles.

Mendel’s Rules of Segregation and Dominance
The observations and conclusions that Mendel made from the monohybrid cross identified that inheritance of a single trait could be described as passage of genes (particles) from parents to offspring. Each individual normally contained two particles and these particles would separate during production of gametes. During sexual reproduction, each parent would contribute one of these particles to reconstitute offspring with 2 particles. In the modern language, we refer to the genetic make-up of the two “particles” (in this case, alleles) as the genotype and the physical manifestation of the traits as the phenotype. Therefore, Mendel’s first rues of inheritance are as follows:
- Law of Segregation
- During gamete formation, the alleles for each gene segregate from each other so that each gamete carries only one allele for each gene
- Law of Dominance
- An organism with at least one dominant allele will have the phenotype of the dominant allele.
- The recessive phenotype will only appear when the genotype contains 2 recessive alleles. This is referred to as homozygous recessive
- The dominant phenotype will occur when the genotype contains either 2 dominant alleles (homozygous dominant) or on dominant and one recessive (heterozygous)

The Single Trait Cross (Monohybrid Cross)


Corn Coloration in an F2 Population (activity)
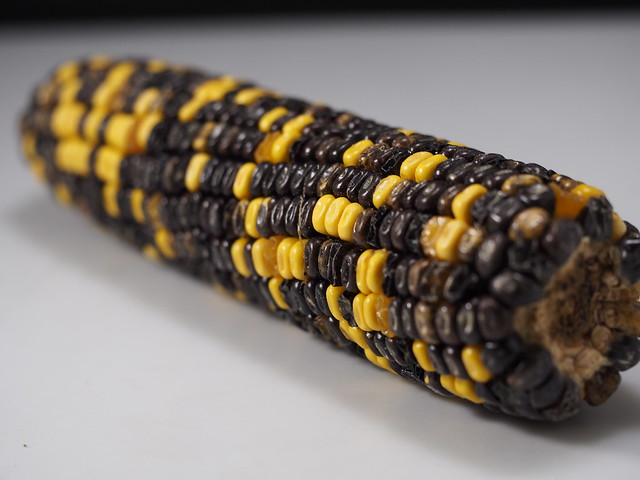
A corn cob contains hundreds of kernels. Each kernel is a seed that represents an individual organism. In the cob, we can easily see kernel color as a phenotype.
- Retrieve an F2 corn cob
- Count a total of 100 kernels
- Tally the number of Yellow Kernels within that 100 (in the dried state, anything yellow or honey colored counts as yellow)
- Tally the number of Purple Kernels within that 100 (in the dried state, purple colored kernels may appear brown)
- Ignore any speckled kernels that may have yellow and purple within them
- Compare numbers with the class as a whole
- From the numbers:
- Is there a dominant color?
- Which is dominant, if there is?
- Create a Punnet square to illustrate the expected number of each color in a simple dominant:recessive paradigm.
Tags: cultural awareness, visual communication, integration of knowledge

