As a demonstration, the instructor may illustrate the concept of size exclusion on a set of mixed food coloring.
Size exclusion chromatography of food coloring
Pack column with 3 ml sepharose slurry
Let the column empty over a beaker
Carefully load 0.2 ml of food coloring mixture onto the column
Place 10 tubes on a rack under the column
Place 1 ml buffer on column and collect 0.5 ml fractions
Continue to add buffer 1 ml at a time until all fractions have been collected
Size-exclusion of Proteins
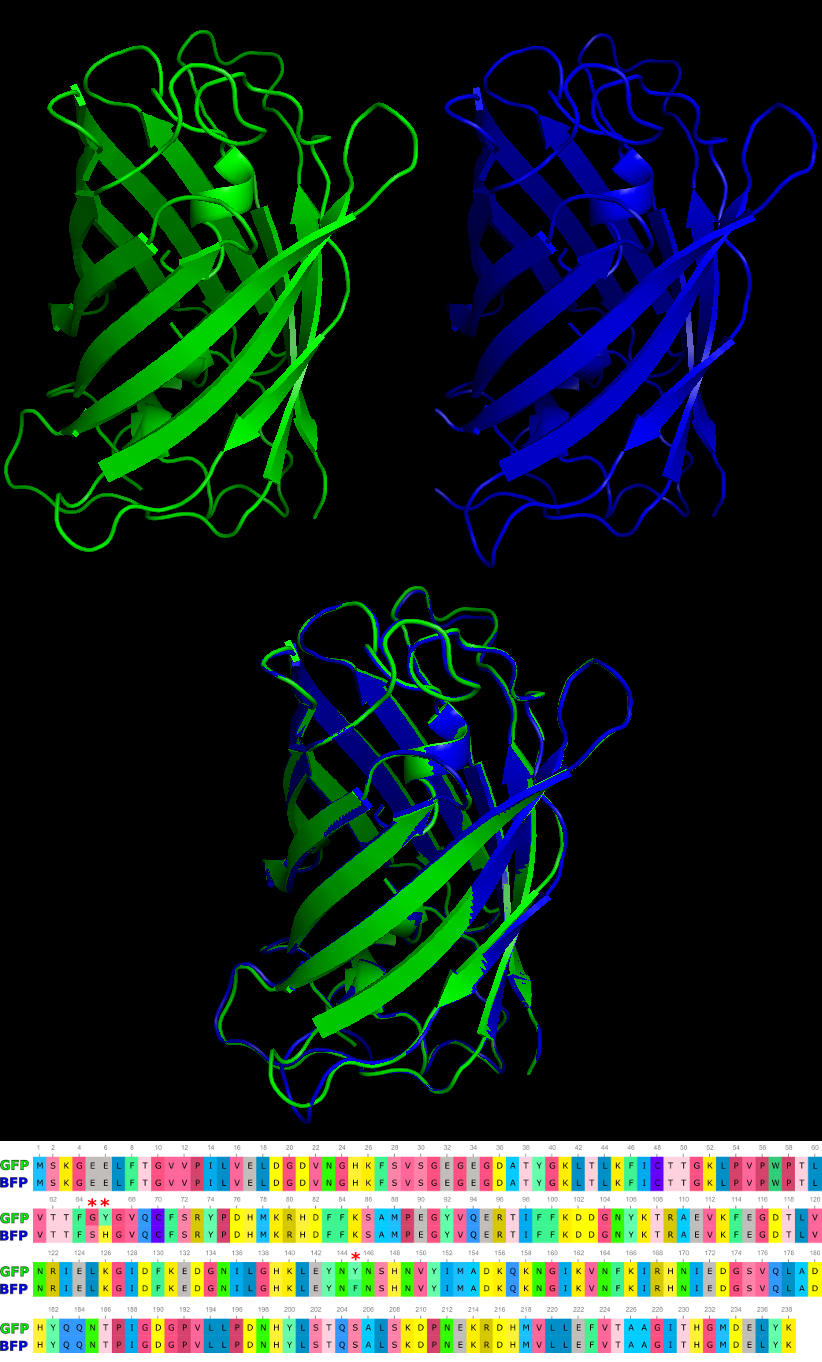
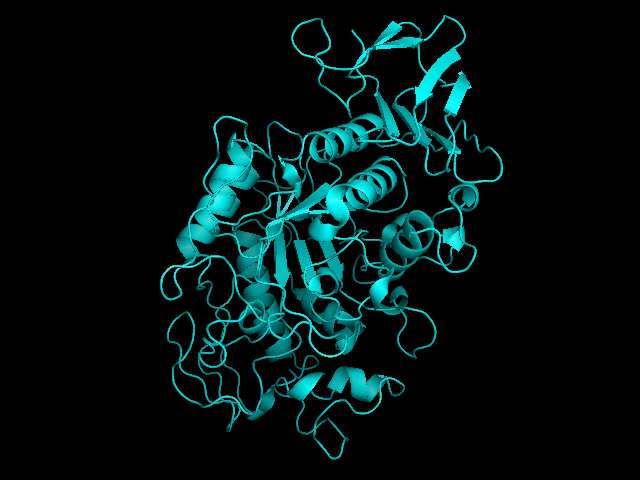
This exercise seeks to purify Green Fluorescent Protein (GFP) or Blue Fluorescent Protein (BFP) from bacterial lysate. These proteins have a specific size of 238 amino acids and are 40,000 daltons (40kD). Based on their specific size, they will have a specific rate of migration through the size exclusion resin. Remember that the bacterial lysate is full of additional proteins that are not your protein of interest that we are attempting to isolate.
3D model of GFP (Top Left), BFP (Top Right), structural alignment of GFP and BFP (Center) and the sequence alignment (Bottom) illustrating the 3 amino acid changes to produce the alternative protein. Red asterisks indicate location of mutations.
Drops of fluid will be collected in fractions. The fractions containing the fluorescent proteins will be found only in specific fractions that will be visible under UV illumination.
Vertically mount the column on a ring stand. Make sure it is straight.
Slide the cap onto the spout at the bottom of the column.
Mix the slurry (molecular sieve) thoroughly by swirling or gently stirring.
Carefully pipet 2 ml of the mixed slurry into the column by letting it stream down the inside walls of the column.
Place an empty beaker under the column to collect wash buffer.
Remove the cap from the bottom of the column and allow the matrix to pack into the column.
Label eight microcentrifuge tubes #1-8.
Slowly load the column with 0.2ml of the GFP extract. Allow the extract to completely enter the column.
Add 1ml of elution buffer on top of resin without disturbing the resin
Add buffer slowly (several drops at a time) to avoid diluting the protein sample.
Using the graduated marks on the sides of the tubes, collect 0.5ml fractions in the labeled microcentrifuge tubes.
Continue to add 1ml buffer and collect fractions until all tubes are full
Check all fractions by using long wave U.V. light to identify tubes that contain the fluorescent GFP or BFP proteins.
Further purification may be performed with a different resin with the few fractions containing the protein of interest
Protein samples should be run on an acrylamide gel and stained against all proteins to check the purity of the sample or fluorescence measurements taken
Recombinant DNA technology has many uses in basic scientific research to better understand the nature of of living things. As a tool, recombinant DNA technology can be used to express proteins towards medical applications. Prior to biotechnology, type I diabetes (insulin-dependent) was treated by injection of insulin isolated from the pancreas of pigs. With the ability to express human proteins inside bacteria, yeast and other cells, sacrificing pigs for porcine insulin is no longer necessary.
Bacterial expression vector pGEX-3X contains the AmpR gene, origin of replication, MCS downstream of the hybrid lac/trp promoter (tac) and the coding sequence for glutathione-S-transferase (GST). GST acts as a tag that is fused directly with the protein from the gene of interest and used to purify the protein with a glutathione resin.
Bacteria or other cells can be engineered to express proteins through the process of cloning and transformation. Bacteria are advantageous because of their rapid life cycle and ease of growth. A bacterial expression vector contains the basic plasmid features: origin of replication as well as antibiotic resistance gene. Often, an affinity tag will be used to aid in purification of the protein. An example in the vector above shows the GST (glutathione-s-transferase) tag that can be purified with glutathione resin. Expression is only the first problem since bacteria are also synthesizing proteins that are required for the bacteria to grow and divide. Injecting these proteins in addition to insulin would cause an immune reaction that could be deadly. Therefore, it is required that overexpressed proteins be purified and isolated from other undesirable proteins.
Criteria for Choosing an Expression System
Protein expression systems have inherent advantages and disadvantages. The table above summarizes the comparison of the various cellular systems of production (Fernandez & Hoeffler, 1999).
A bioreactor or fermenter that is used to grow large amounts of bacteria for the production of protein.
Purification
Different methods of isolation can be applied depending on the properties of the protein. Ion exchange chromatography is useful if the protein of interest has a specific charge that will interact with a resin packed with the opposite charge.
Immunoprecipitation
Immunoprecitation: Column is packed with Protein-A agarose which binds to antibodies. Cell lysates are then loaded onto the columns where they flow through and are allowed to interact with the antibody. Washes are performed to remove the non-specifically bound proteins. An elution buffer is used to disrupt the interaction of the antibody to the protein target.
Affinity Purification
Affinity purification employs the use of specific antibodies that bind to the protein of interest very tightly to retain it on a column. With these techniques, the protein retained on the resin is washed numerous times to remove other proteins that are non-specifically sticking. A change in pH or ionic conditions then is used to disrupt the interaction with the resin and elute the proteins from the column. Proteins that are engineered to contain tags can be purified by antibodies specific to those tags. Also, the addition of 6 or more consecutive Histidine residues to the end of a protein make them susceptible to purification with Nickel-NTA resin or Cobalt purification. In these cases, the 6XHis tag associates with these metal ions on the resin and are selectively adhered.
Nickel NTA resin coordinating the capture of a 6His tagged protein
Size Exclusion
Most of you are familiar with water purification filters. Before using these filters, you soak them in water and dark residue leaks out. This dark residue is activated charcoal. The activated charcoal has tiny microscopic pores that trap small items like ions and other particles. The primary goal of these filters is to remove metals and chlorine that are found in tap water. The porous nature of activated charcoal renders it useful for trapping molecules in water purification systems . The process used to trap these small particles is called size exclusion. Unlike agarose gel electrophoresis where the smaller particles navigate through the matrix faster, size exclusion resins trap the smaller molecules.
The smaller the molecule, the longer they spend within the pores as they traverse through the matrix.
Significance of Purification
All injectible drugs must be clean of endotoxins from bacteria. Purification of the protein of interest from bacterial lysates removes the dangerous pathogenic materials from that would otherwise activate host immune reactivity.
The horseshoe crab (Limulus polyphemus) performs a special function in the ecosystem by providing eggs for migratory birds to feed on. This organism also houses a special cell type in its hemolymph. The limulus amoebocyte lysate (LAL) test is the most sensitive assay of detecting endotoxins from bacteria. Amoebocytes are collected from these organisms for use on testing batches of injectible drugs to ensure proper purification and safety.
Morphometrics (morpho– shape; metrics– measurements) is the use of physical measurements to determine the relatedness of organisms. With extinct organisms that have died out long ago, DNA extraction proves to be difficult. Likewise, prior to DNA technologies to analyze species, Linnean taxonomy was ascribed to organisms based on similarities in features.
Describing Species and Variation of Morphologies
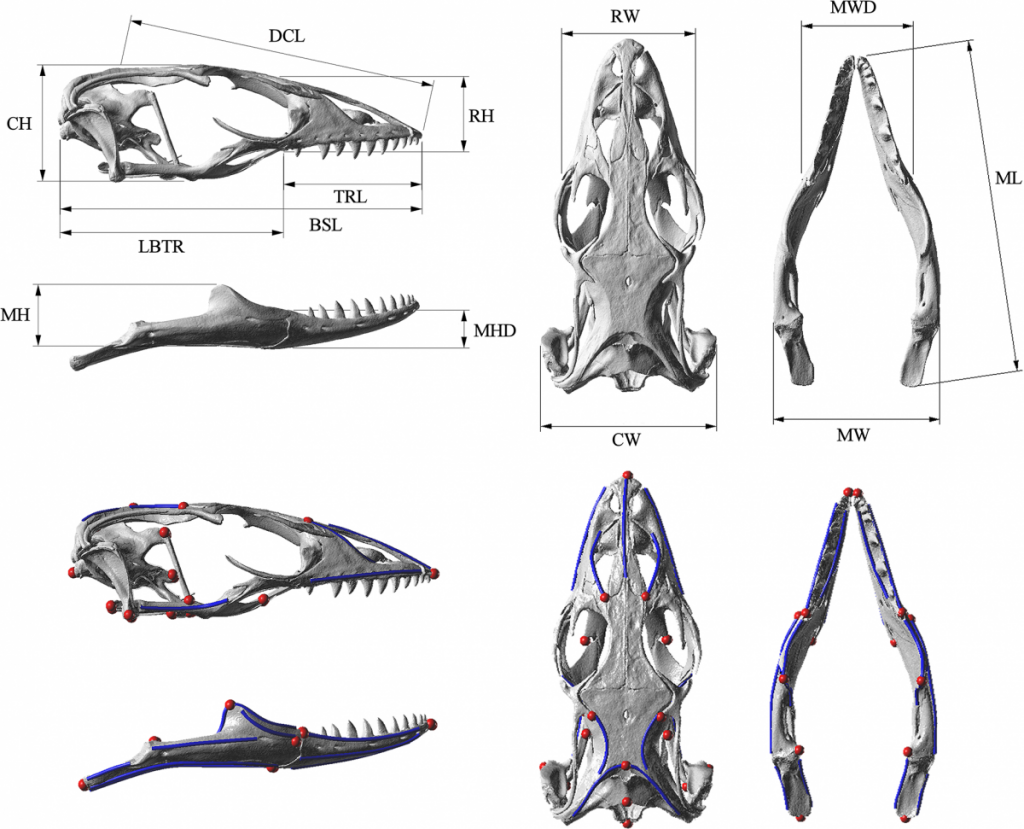
Below are images of skull landmarks of the lizard family Varanidae. This family includes monitor lizards and Komodo Dragons.As can be seen below, the general morphology of the skulls are similar enough that they all retain the same landmarks. The figure below also illustrates the diversity in these lizards that illustrate a large variety between species.
Having a set of shared landmarks provides the opportunity to make systematic measurements of morphometric features.
Landmarks and measurement metrics for the morphometric analysis of skulls. McCurry et al. (2015) (CC-BY)
Euclidean distance to measure relatedness
Euclidean distance is a measurement derived from Pythagorean geometry that describes the shortest distance (d) between 2 points (A & B) as a straight line using triangulation. In a cartesian space, the points can be defined:
and
Standard pythagorean theorem can be expressed as:
To find the distance between the 2 points, we utilize algebra to calculate for .
In this case, we expand to comparing the coordinates of the two points:
and
We can then expand this idea to include the differences of data points that describe the comparisons of multiple measurements.
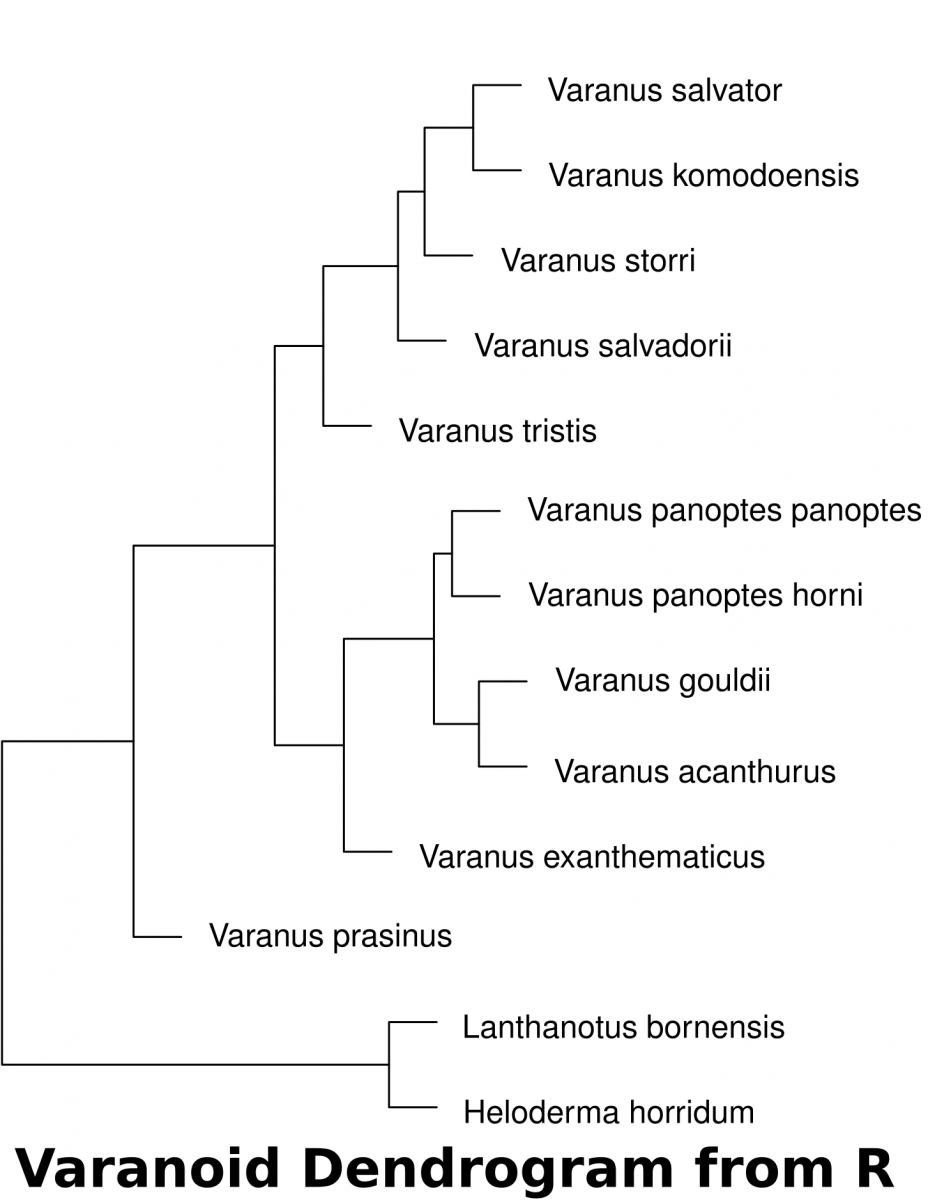
Calculating distance with R
Download the dataset(McCurry et al. 2015) associated with this activity (a Comma Separated Value .csv file). This can be used in a spreadsheet or in a text editor. This data can be imported into R to determine the euclidean distances of landmarks.
The following code in R will download the data set into a variable called “varanoid”, measure euclidean distance and save a plot into a PDF file in a directory called “/tmp”.
## install curl for fetching from internet if it isn't
install.packages('curl')
## Load the curl library
library(curl)
## read the data of measurements and assign it to a variable 'varanoid'
varanoid = read.csv(curl('https://raw.githubusercontent.com/jeremyseto/bio-oer/master/data/varanoid.csv'))
## set the row names to the Species column
row.names(varanoid) = varanoid$Species
## remove the first column of the table to have purely numeric data
varanoid_truncated = (varanoid[,2:14])
## calculate distance using euclidean as the method
dist_measure = dist(varanoid_truncated, method='euclidean')
## display dist_measure to look at the comparisons
dist_measure
varanoid_cluster = hclust(dist_measure)
## open PDF as a graphics device  to save a file in the '/tmp' directory
pdf(file='/tmp/varanoid_tree.pdf')
plot(varanoid_cluster)
dev.off()
## close the device to save the plot as pdf
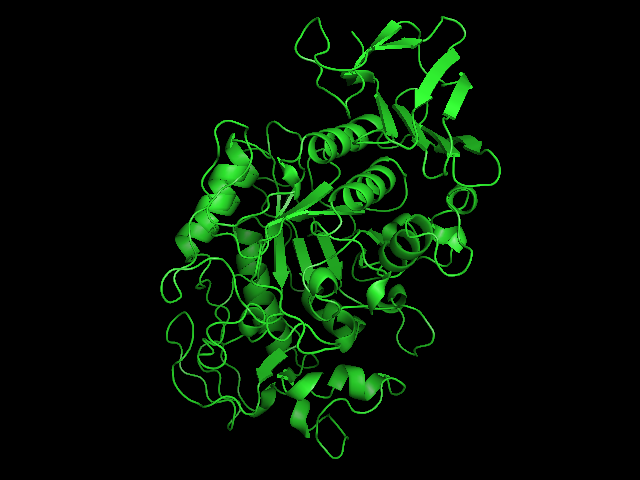
Amylase is an enzyme that breaks down amylose (starch) into glucose molecules.
What test can be used to indicate the presence of Starch?
What test can be used to indicate the presence of glucose?
What is the role of an enzyme in a chemical reaction and what is it made of?
What parameters would influence the ability of the enzyme to facilitate the rate of the reaction?
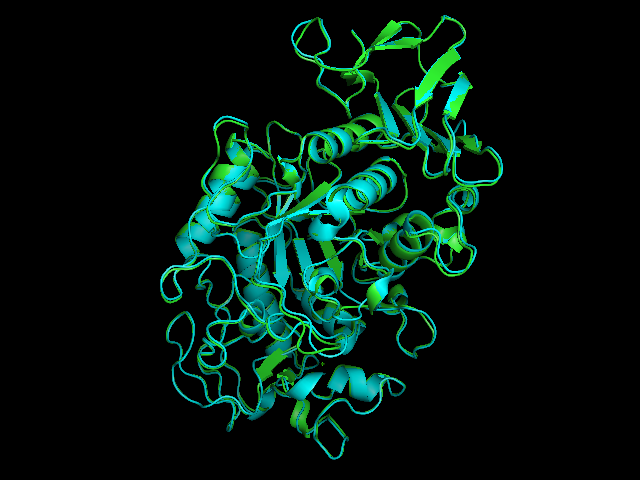
Salivary amylase is produced in the mouth, where digestion begins.Pancreatic amylase is produced in the pancreas and is supplied to the duodenum of the small intestines.Overlay of salivary (green) and pancreatic (teal) amylase molecules. Tags: quantitative reasoning, analysis, inquiry, integration of knowledge
Experimental science looks at cause and effect types of relationships. Controlled experiments vary one of the factors or traits to observe the effect on another factor or trait. These factors are called variables. A dependent variable is something that is observed and expected to change as a result of modifying another factor in the experiment. That is to say, the outcome depends on another factor. The independent variable is the factor or condition that is changing or being changed by the experimenter. Sometimes waiting is the the condition that is changing, making the independent variable: time.
Graphing a line
A graph displaying 2 lines and their equations
A line can be described mathematically by the equation:
y = mx + b
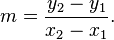
This is referred to as the slope-intercept form. The 2 variables y and x refer to coordinates along each axis. The term m refers to the change in the y-values over the change in the x-values. This is referred to as the slope of the line. The term b, the y-intercept, is the y-value where the line crosses the y-axis.
This is how the slope of a line (m) is determined.
The slope of the line indicates the relationship between the two variables, x and y. The equation of the line y=mx+b indicates to us that “y” occurs as a function of changes to “x”. Sometimes this is represented by the equation f(x)=mx+b . Since “y” depends on “x”, “y is the dependent variable and “x” is the independent variable. As “x” changes, how does “y” change in response? This is what the slope reveals to us.
The difference in nucleotide sequences between humans lies between 0.1-0.4%. That means that people are greater than 99% similar. But when you look around the room at your classmates, you can see that that small difference amounts to quite a bit of variation within our species. The bulk of these differences aren’t even within the coding sequences of genes, but lie outside in regulatory regions that change the expression of those genes. Imagine if there were mutations to the coding sequences, this could be very deleterious to the well-being of the organism. We say that the coding sequences of genes that ultimately lead to proteins has a selective pressureto remain the same. The areas outside of the coding sequences have a reduced and sometimes non-existent selection pressure. These areas are allowed to mutate in sequence and even expand or contract. Areas of changes or differences are called polymorphic(many forms). If you were to read a repetitive set of sequences and count the repetition, you’d make mistakes and lose count. Likewise, DNA
polymerase will make errors or stutter in areas of repetitiveness and produce polymorphic regions.
Tandem Repeats
A type of polymorphism occurs due to these repeats expanding and contracting in non-coding regions. These regions are called variable number tandem repeats (VNTRs)
or sometimes short tandem repeats (STRs). Any region or location on a chromosome is referred to as locus(loci for plural). Scientists use polymorphic loci that are known to
contain VNTRs/STRs in order to differentiate people based on their DNA. This is often used in forensic science or in maternity/paternity cases. Any variation of a locus is referred to as an allele. In standard genetics, we often think of an allele as a variation of gene that would result in a difference in a physical manifestation of that gene. In the case of STRs, these alleles are simply a difference in number of repeats. That means the length of DNA within this locus is either longer or shorter and gives rise to many different alleles. VNTRs are referred to as minisatellites while STRs are called microsatellites.
CoDIS
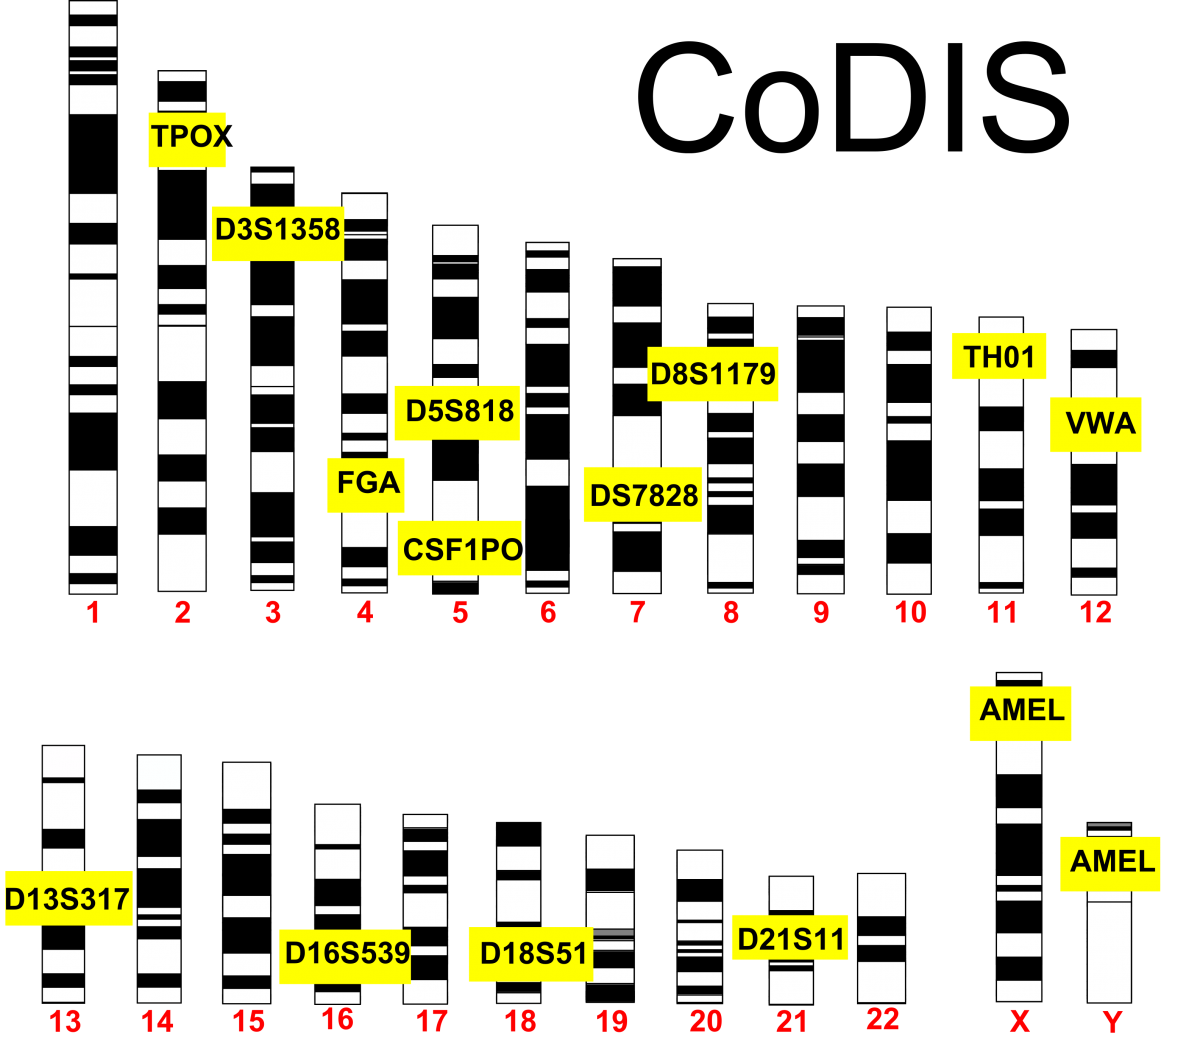
The FBI and local law enforcement agencies have developed a database called the Combined DNA Index System (CoDIS) that gathers data on a number of STRs. By establishing the number of repeats of a given locus, law enforcement officials can differentiate individuals based on the repeat length of these alleles. CoDIS uses a
set of 13 loci that are tested together. As you would imagine, people are bound to have the same alleles of certain loci, especially if they were related. The use of 13 different loci makes it statistically improbable that 2 different people could be confused for each other. Think about this in terms of physical traits. As you increase the number of physical traits used to describe someone, you are less likely to confuse that person with someone else based on those combinations of traits. Using the CoDIS loci increases the stringency since there are many alleles for each locus. The thirteenth locus in CoDIS (called AMEL) discriminates between male and female.
CoDIS STRs: The FBI utilizes 13 different loci to discriminate between people. AMEL discriminates by gender and is located on the X & Y.
Crime Scene Investigation
This lab uses a CoDIS locus called TH01. TH01 is a locus on chromosome 11 that has a repeating sequence of TCAT. There are reported to be between 3-14 repeats in this locus. With the exception of X and Y in a male, all chromosomes have a homologous partner. Therefore, each individual will have 2 alleles for each CoDIS locus.
TH01 STR: Outside of the STR, there is flanking areas of known sequence. The primers that amplify TH01 in PCR recognize these flanking sequences to amplify the TCAT repeats.
At a crime scene, criminals don’t often leave massive amounts of tissue behind. Scant evidence in the form of a few cells found within bodily fluids or stray hairs can be enough to use as DNA evidence. DNA is extracted from these few cells and amplified by PCR using the specific primers that flank the STRs used in CoDIS.
DNA evidence from a crime scene: DNA can be extracted from cells found from various sources at a crime scene. PCR can amplify this small amount of DNA.
Amplified DNA will be separated by gel electrophoresis and analyzed. Size reference standards and samples from the crime scene and the putative suspects would be analyzed together. In a paternity test, samples from the mother, the child and the suspected father would be analyzed in the same manner. A simple cheek swab will supply enough cells for
this test.
TH01 locus used in a Paternity/Maternity test: Individual PCR reactions are run for each sample (mom, dad, child). The TH01 primer pair specifically amplifies the locus. Each amplified sample is run on the same gel to resolve the different alleles of TH01 from each individual. From this test the sample could be the offspring from these 2 parents but use of more STRs would make it more definitive. Count the TCATs.
Agarose is a linear carbohydrate polymer purified from the cell walls of certain species of algae. Agar is a combination of the crude extract that contains agarose and the smaller polysaccharide agaropectin. When dissolved and melted in liquid, agarose strands become tangled together to form a netting that holds the fluid in a gel. Reduction of the fluid creates a higher percentage gel that is firmer and contains smaller pores within the netting.
Placing a comb within the melted agarose creates spaces that allow for the insertion of samples when the gel is solidified. Molecules can traverse through the pores as they are drawn by electrical currents. Charged compounds will migrate towards the electrode of opposite charge but migration rate will be influenced by the size of the molecules. Smaller compounds can easily traverse through the webbing while larger items are retarded by the pore size. Follow this simulation to get a better idea of how we use Agarose Gel Electrophoresis in molecular biology to study DNA fragments.
DNA molecules are not readily visible when resolved (separated) on an agarose gel. In order to visualize the molecules, a DNA dye must be administered to the gel. In research labs, a DNA intercalating agent called Ethidium Bromide is added to the molten gel and will bind to the DNA of the samples when run. Ethidium Bromide can then be visualized on a UV box that will fluoresce the compound and reveal bands where DNA is accumulated. Since Ethidium Bromide is known as a carcinogen, teaching labs will use a safer DNA intercalating agent known as Sybr Green. This can be visualized in a similar fashion, but will fluoresce a green color instead.
Agarose gels are made of and bathed in a buffered solution, usually of Tris-Borate-EDTA (TBE) or Tris-Acetate-EDTA (TAE). Regardless of buffer solution, the buffer provides necessary electrolytes for the current to pass through and maintain the pH of the solution.
DNA samples are prepared in a buffer similar to the solution that it will be run in to ensure that the phosphate backbone of the DNA remains deprotonated and moves to the positive electrode. Additionally, glycerol or another compound is added to this buffer in order for the solution to sink into the wells without spreading out. A dye is often included in this loading buffer in order to visualize the loading in the wells and to track the relative progression of gel.


.jpg)

") and
and ")

 .
.
 and
and 

 = \sqrt{\sum_{k=1}^{p}(X_{ik} - X_{jk})^2}\")


.jpg)


