Contents
Observe Osmosis Along A Free Energy Gradient
- Obtain four pieces of water-soaked dialysis tubing 15 cm long and eight pieces of string. Seal one end of each tube by tying it into a knot.
- Open the other end of the tube by rolling it between your thumb and finger.
- write A, B, C, D on 4 pieces of paper
- insert the labels into individual bags
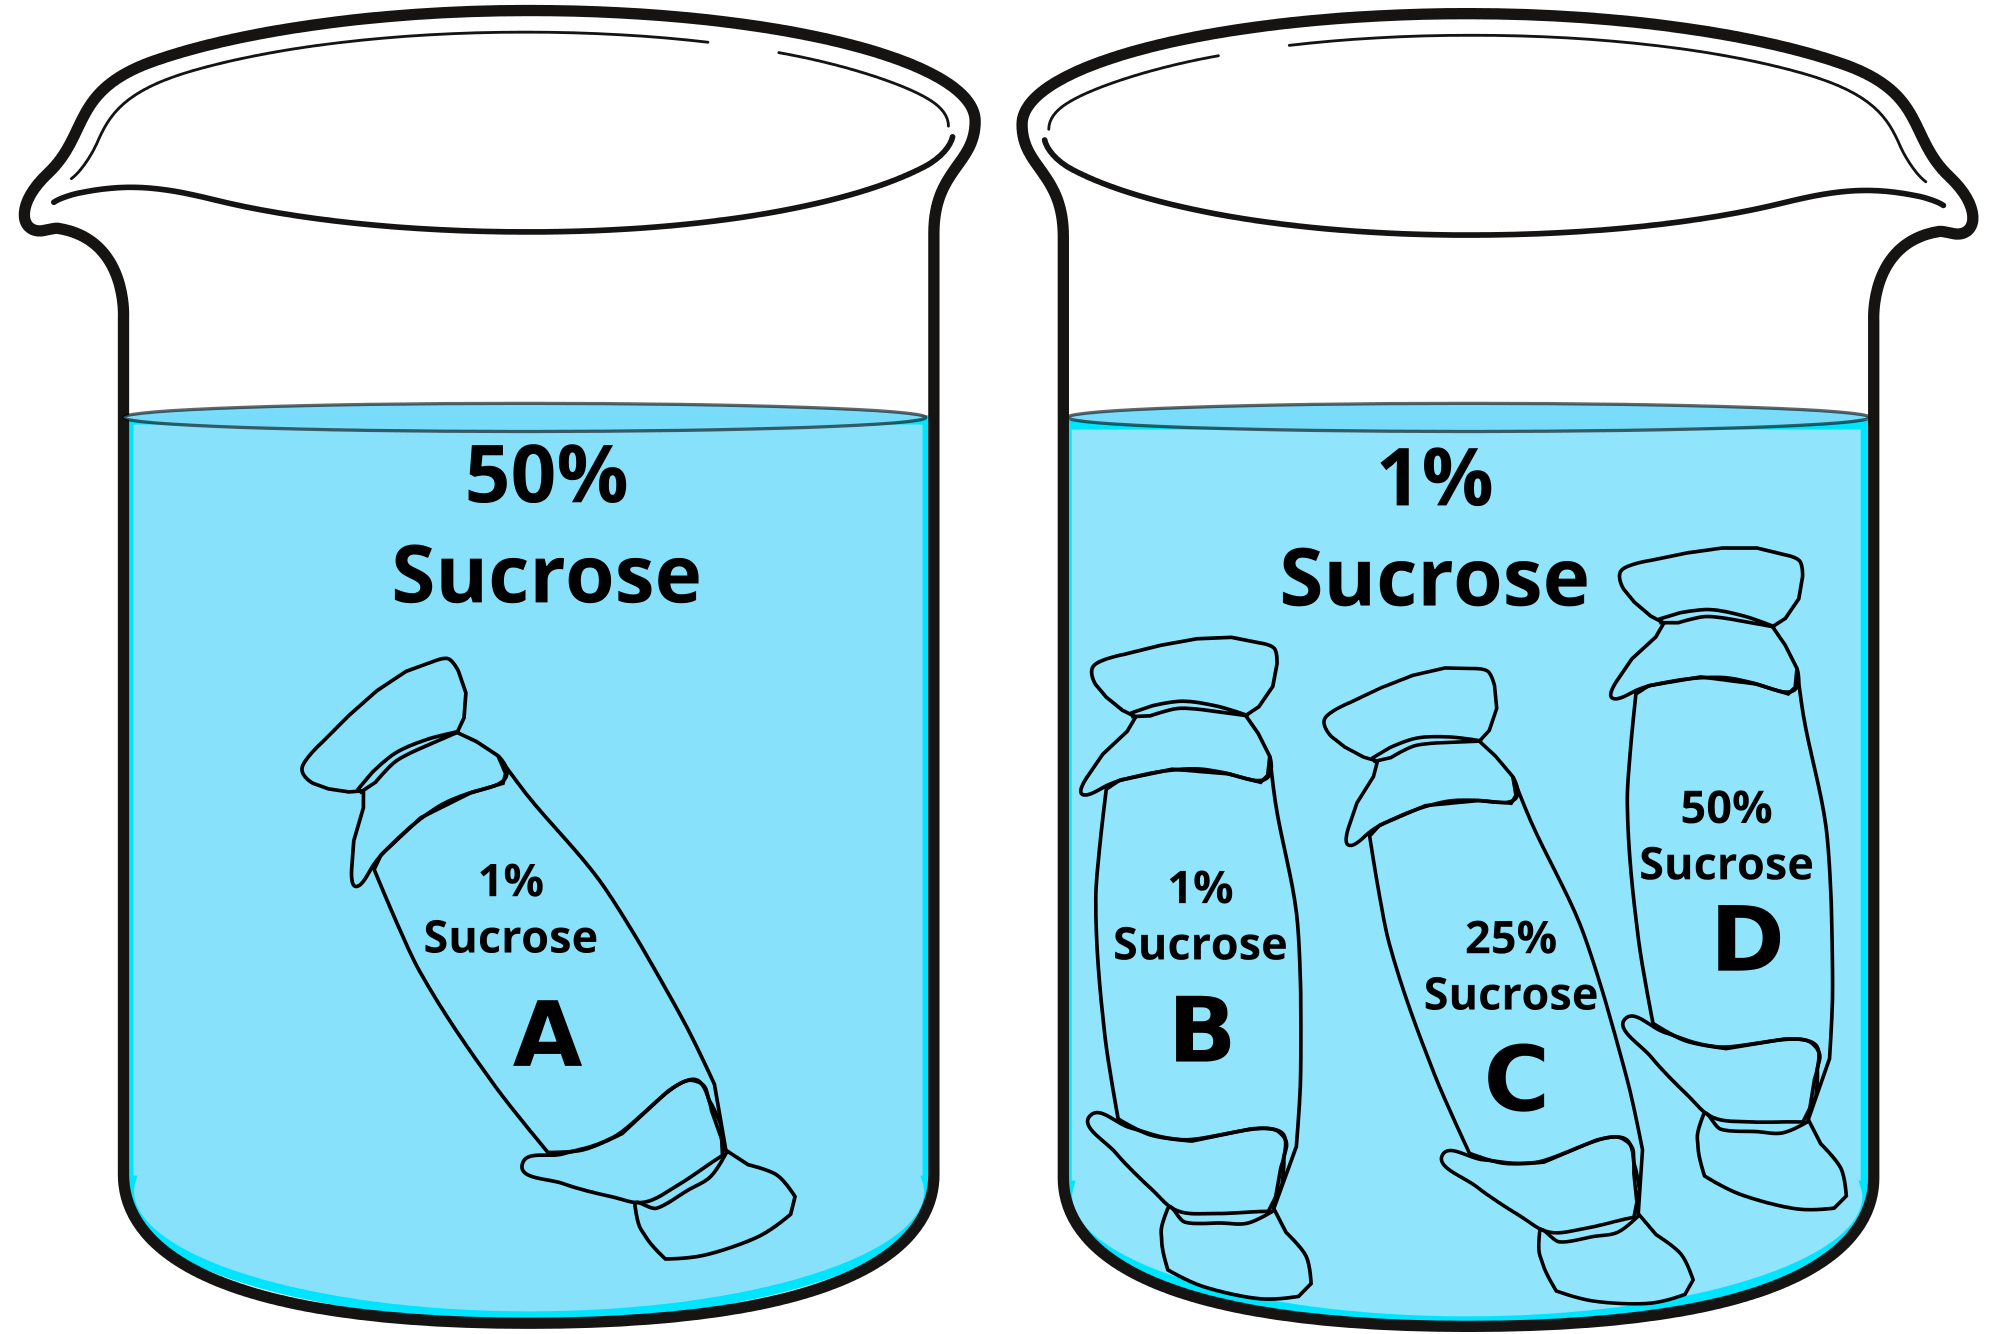
- Fill the bags with the contents shown in the figure below with 10 ml of solution.
- Bag A 10ml 1% Sucrose
- Bag B 10 ml 1% Sucrose
- Bag C 10 ml 25% Sucrose
- Bag D 10 ml 50% Sucrose
- For each bag, loosely fold the open end and press on the sides to push the fluid up slightly and remove most of the air bubbles. Tie the folded ends securely, rinse the bags, and check for leaks.
- Blot excess water from the outside of the bags and weigh each bag to the nearest 0.1 gram.
- Record the weights in Data Table 1: Weight of Dialysis Bags.
- Place bags B, C, and D in a beaker or large bowl filled with 1% sucrose. Record the time.
- Place bag A in an empty beaker and fill the beaker with just enough 50% sucrose to cover the bag. Record the time.
- Remove the bags from the beakers at 15-minute intervals for the next hour, blot them dry, and weigh them to the nearest 0.1 g. Handle the bags delicately to avoid leaks, and quickly return the bags to their respective containers. For each 15-minute interval record the total weight of each bag and its contents in Data Table 1. Then calculate and record in Data table 2: Change in Weight of Dialysis Bags the change in weight from the initial weight.
Stop and Think:
-
Define the tonicity of the solution inside the bag relative to the outside
-
Based on your definitions, hypothesize the direction the solution will move (in or out of the bag) and fill in the table below
Hypothesized Movement of Solution based on Tonicity
|
Bag |
Tonicity Inside Bag Relative to the Solution |
Tonicity of Outside Solution relative to the Bag |
Hypothesized solution movement (in, out, none) |
|
A |
|||
|
B |
|||
|
C |
|||
|
D |
Data Table 1: Weight of Dialysis Bags
-
Bag
0 Min
15 Min
30 Min
45 Min
60 Min
A
B
C
D
Data table 2: Net Weight Change of Dialysis Bags
-
Bag
0 Min
(WT0-WT0)
15 Min
(WT15-WT0)
30 Min
(WT30-WT0)
45 Min
(WT45-WT0)
60 Min
(WT60-WT0)
A
0g
B
0g
C
0g
D
0g
-
Present your data:
-
Plot your data using only the Change in Weight. (subtract the Initial Weight at 0 minutes from the Total Weight at each time point)
-
Change in Weight = Total Weightcurrent_time – Initial Weighttime_0
-
-
Using a computer, create a scatter plot of the data from Table 2 and calculate the equation of the line
Conclude:
-
Did your results match your hypotheses?
-
What do the slopes of the lines generated from plotting Change Weight indicate to you?
-
Can you analyze and articulate in words what has occurred with respect to these slopes?

