For the most part, mammals have gender determined by the presence of the Y chromosome. This chromosome is gene poor and a specific area called sex determining region on Y (SRY) is responsible for the initiation of the male sex determination. The X-chromosome is rich in genes while the Y-chromosome is a gene desert. The presence of an X-chromosome is absolutely necessary to produce a viable life form and the default gender of mammals is traditionally female.
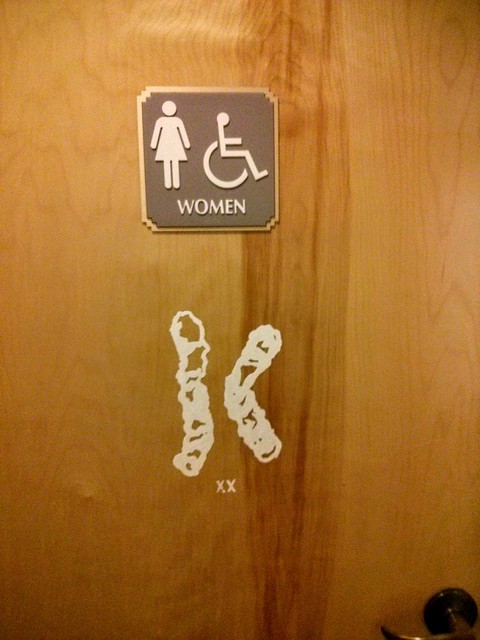
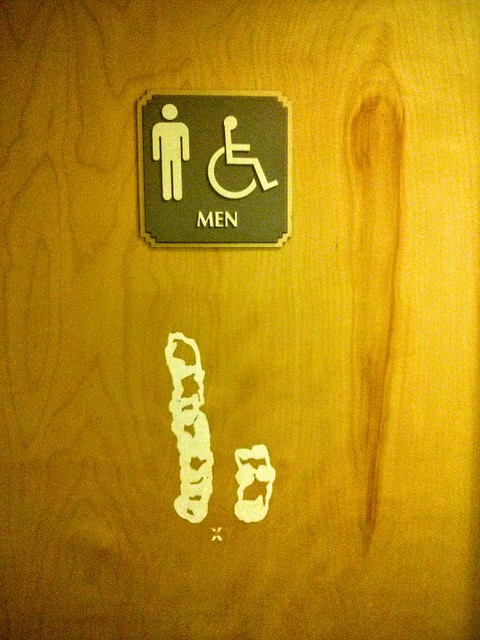
The human X-chromosomeThe minuscule human Y-chromosome
Chromosomal painting techniques can reveal the gender origin of mammalian cells. By using fluorescent marker sequences that can hybridize specifically to X or Y chromosomes through Fluorescence In Situ Hybridization (FISH), gender can be identified in cells.
DNA can be cut by restriction endonucleases (RE). Endonucleases are enzymes that can hydrolyze the nucleic acid polymer by breaking the phosphodiester bond between the phosphate and the pentose on the nucleic acid backbone. This is a very strong covalent bond while the weaker hydrogen bonds maintain their interactions and double strandedness.
As the name implies, restriction endonucleases (or restriction enzymes) are “restricted” in their ability to cut or digest DNA. The restriction that is useful to biologists is usually palindromic DNA sequences. Palindromic sequences are the same sequence forwards and backwards. Some examples of palindromes: RACE CAR, CIVIC, A MAN A PLAN A CANAL PANAMA. With respect to DNA, there are 2 strands that run antiparallelel to each other. Therefore, the reverse complement of one strand is identical to the other. Molecular biologists also tend to use these special molecular scissors that recognize palindromes of 6 or 8. By using 6-cutters or 8-cutters, the sequences occur throughout large stretches rarely, but often enough to be of utility.
EcoRI generates sticky of cohesive endsSmaI generates blunt ends
Restriction enzymes hydrolyze covalent phosphodiester bonds of the DNA to leave either “sticky/cohesive” ends or “blunt” ends. This distinction in cutting is important because an EcoRI sticky end can be used to match up a piece of DNA cut with the same enzyme in order to glue or ligate them back together. While endonucleases cut DNA, ligases join them back together. DNA digested with EcoRI can be ligated back together with another piece of DNA digested with EcoRI, but not to a piece digested with SmaI. Another blunt cutter is EcoRV with a recognition sequence of GAT | ATC.
Restriction fragment length polymorphism (RFLP) is a technique that exploits variations in DNA sequences. DNA from differing sources will have variations or polymorphisms throughout the sequence. Using Restriction Enzymes, these differences in sequences may be teased out. However, if one were to take the entirety of the human genome and chop it up with a restriction enzyme, many indecipherable fragments would be made. In fact, the resulting agarose gel would simply show a large smear of DNA. RFLP analysis requires that a probe to a specific area of DNA be used to identify specific locations. Agarose gels would be transferred to a membrane or filter where they would be hybridized to these radioactive probes.
Homologous chromosomes with restriction sites noted by triangles. the rectangle sitting on the chromosomes correspond to a probe locus.RFLP analysis was designed for forensic science to discriminate between people. Since people are 2N, they have pairs of homologous chromosomes with the same loci. However, these loci may contain different alleles. In this case, the phenotype for these alleles is the actual sequence that may or may not contain restriction sites. The presence or absence of a restriction site may arise from single nucleotide polymorphisms (SNPs) that reveal the natural variation between people.
The schematic below illustrates a comparison of restriction profiles between two sources. Note that the probe overlaps a restriction site in one of the alleles. This probe will be able to bind to both fragments given sufficient sequence overlap. Upon resolving on an agarose gel, genomic DNA that does not hybridize with the probe will obscure the locus of interest as a large smear. A filter is placed on top of the agarose and pressed against it to transfer the DNA in a process called Southern Blotting. Following a lengthy transfer, the filter is denatured to and incubated with the radioactive probe. To visualize this probe hybridization, film is exposed to the filter and processed.
Sample A only reveals one band after processing because this person is homologous for the same allele. Sample B is heterozygous and reveals three bands.Following restriction digestion, the samples are resolved on an agarose gel. Digestion of genomic DNA will result in a large smear. Following transfer of the DNA onto a membrane through capillary action, the membrane is probed with radioactive probe DNA. Probe binds selectively to complementary sequences to reveal a series of distinct bands. An interactive demonstration of the first DNA fingerprinting.RFLPs represent inheritable markers and can reveal relationships between different individuals. A pedigree can illustrate the relationship of the inherited alleles. The technique can be more informative if using multiple probes simultaneously for different loci or to use multi-locus probes that hybridize to multiple locations.
While RFLPs can arise from SNPs, they may also be caused by the expansion or contraction of repeated elements between restriction sites. These repeated elements of DNA are referred to as Variable Number Tandem Repeats (VNTR) and illustrate polymorphisms that normally occur in non-coding regions of the genome.
The polymerization of nucleic acids occurs in a 5′ → 3′ direction. The 5′ position has a phosphate group while the 3′ position of the hexose has a hydroxyl group. Polymerization depends on these 2 functional groups in order for a dehydration synthesis reaction to occur and extend the sugar-phosphate backbone of the nucleic acid. In the 1970’s, Fred Sanger’s group discovered a fundamentally new method of ‘reading’ the linear DNA sequence using special bases called chain terminators or dideoxynucleotides. The absence of a hydroxyl group at the 3′ position blocks the polymerization resulting in a termination. This method is still in use today it is called: Sanger dideoxynucleotide chain-termination method. This method originally used a radioactively labeled primer to initiate the sequencing reaction. Four reactions take place where each reaction is intentionally “poisoned” with a dideoxy chain terminator. For example, 1 reaction will have all 4 dNTPs (deoxynucleotide triphosphates)with the addition to a small amount of ddATP (dideoxyadenosine triphosphate). This reaction will result in a series of premature terminations of the polymerization specifically at different locations where an Adenine would be incorporated.
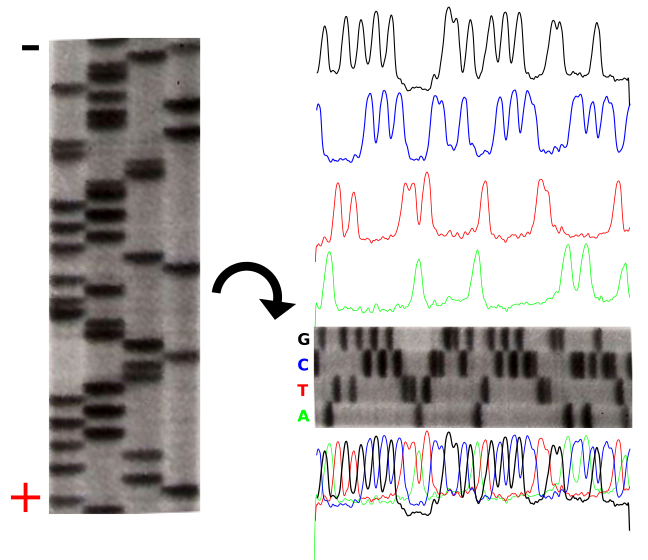
dATP is a natural monomer used in the polymerization of DNA. The 3′-OH is the attachment point of the next subsequent nucleotide.The lack of a 3′-OH in this molecule of ddATP makes it a chain terminator that will prohibit the addition of another nucleotide to the DNA polymerThe product of these 4 separate sequencing reactions is run on a large polyacrylamide sequencing gels. The smallest fragments run through the gel the fastest and create a ladder-like pattern. This can be visualized through use of an x-ray film that is sensitive to the radioactivity. Each lane of the gel corresponds to one of the four chain terminating reactions. The bases are read sequentially from the bottom up and reveals the sequence of the DNA.
The sequencing gel can be manually scored. The profiles of each lane have been created using ImageJ to illustrate the banding pattern and subsequent sequence.
Fluorescent Chain Termination and Capillary Electrophoresis
Radioactivity is dangerous and undesirable to work with so chain terminators with fluorescent tags were developed. This method synthesizes a series of DNA strands that are specifically fluorescent at the termination that is passed through a capillary electrophoresis system. As the fragments of DNA pass a laser and detector, the different fluorescent signal attributed to each ddNTP is identified and generates a chromatogram to represent the sequence. Fluorescent Chain Terminators are now used in reactions and run through a small capillary. The smallest fragments run through first and are detected to reveal a chromatogram .
Fluorescent Chromatograms are sued to score the the nucleotide chain termination. The amplitude of each peak corresponds to the strength or certainty of the nucleotide call. Chromatogram files are usually provided alongside the sequence file with the extension *.ab1 while the sequence files are provided as a text file in the fasta format. More about these files can be found here. The ab1 files are extremely important to analyze when there is ambiguity or sequencing errors. These ab1 files can also be used to ascribe a quality score on the base call.
When there is too much ambiguity in the signal because of multiple peaks, you will often find a N in place of one of the 4 nucleotides (A,T,C,G).
This video (source: www.yourgenome.orgCC-BY) illustrates the mechanism of fluorescent chain termination and capillary electrophoresis.
Sequencing Genomes
Traditional sequencing of genomes was a long and tedious process that cloned fragments of genomic DNA into plasmids to generate a genomic DNA library (gDNA). These plasmids were individually sequenced using Sanger sequencing methodology and computational was performed to identify overlapping pieces, like a jigsaw puzzle. This assembly would result in a draft scaffold.
The video below is taken from yourgenome.org (CC-BY) and illustrates the sequencing of the human genome through the shotgun sequencing approach.
Morphometrics (morpho– shape; metrics– measurements) is the use of physical measurements to determine the relatedness of organisms. With extinct organisms that have died out long ago, DNA extraction proves to be difficult. Likewise, prior to DNA technologies to analyze species, Linnean taxonomy was ascribed to organisms based on similarities in features.
Describing Species and Variation of Morphologies
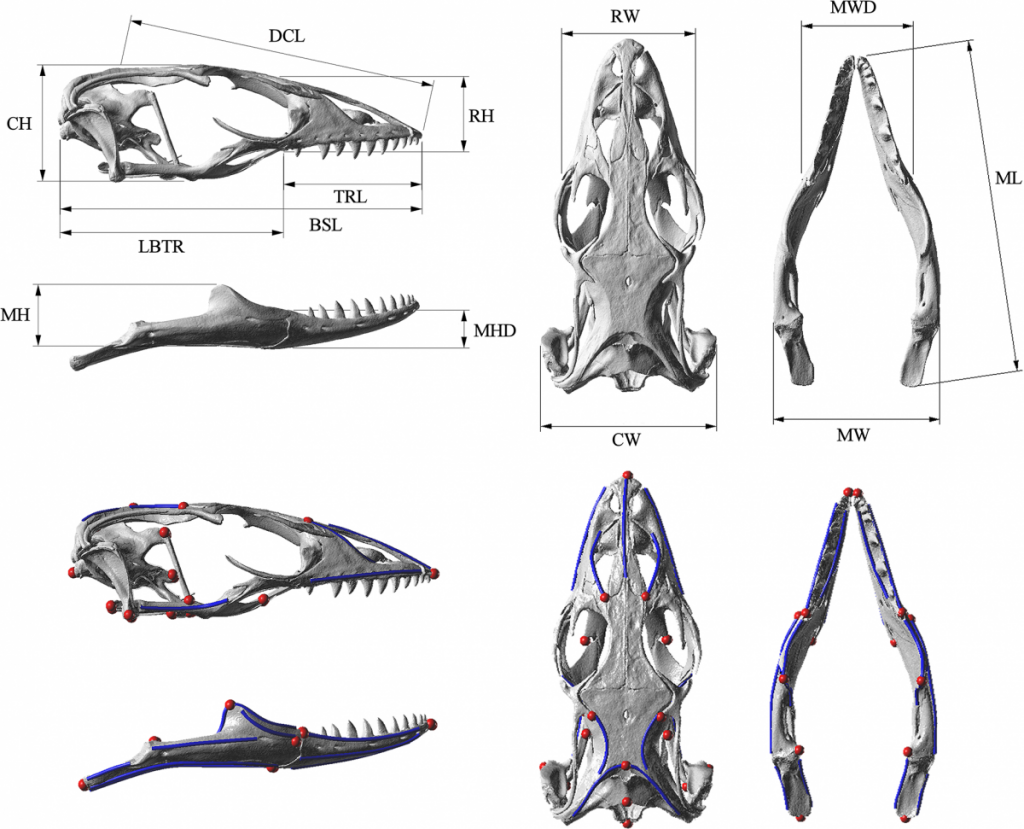
Below are images of skull landmarks of the lizard family Varanidae. This family includes monitor lizards and Komodo Dragons.As can be seen below, the general morphology of the skulls are similar enough that they all retain the same landmarks. The figure below also illustrates the diversity in these lizards that illustrate a large variety between species.
Having a set of shared landmarks provides the opportunity to make systematic measurements of morphometric features.
Landmarks and measurement metrics for the morphometric analysis of skulls. McCurry et al. (2015) (CC-BY)
Euclidean distance to measure relatedness
Euclidean distance is a measurement derived from Pythagorean geometry that describes the shortest distance (d) between 2 points (A & B) as a straight line using triangulation. In a cartesian space, the points can be defined:
and
Standard pythagorean theorem can be expressed as:
To find the distance between the 2 points, we utilize algebra to calculate for .
In this case, we expand to comparing the coordinates of the two points:
and
We can then expand this idea to include the differences of data points that describe the comparisons of multiple measurements.
Calculating distance with R
Download the dataset(McCurry et al. 2015) associated with this activity (a Comma Separated Value .csv file). This can be used in a spreadsheet or in a text editor. This data can be imported into R to determine the euclidean distances of landmarks.
The following code in R will download the data set into a variable called “varanoid”, measure euclidean distance and save a plot into a PDF file in a directory called “/tmp”.
## install curl for fetching from internet if it isn't
install.packages('curl')
## Load the curl library
library(curl)
## read the data of measurements and assign it to a variable 'varanoid'
varanoid = read.csv(curl('https://raw.githubusercontent.com/jeremyseto/bio-oer/master/data/varanoid.csv'))
## set the row names to the Species column
row.names(varanoid) = varanoid$Species
## remove the first column of the table to have purely numeric data
varanoid_truncated = (varanoid[,2:14])
## calculate distance using euclidean as the method
dist_measure = dist(varanoid_truncated, method='euclidean')
## display dist_measure to look at the comparisons
dist_measure
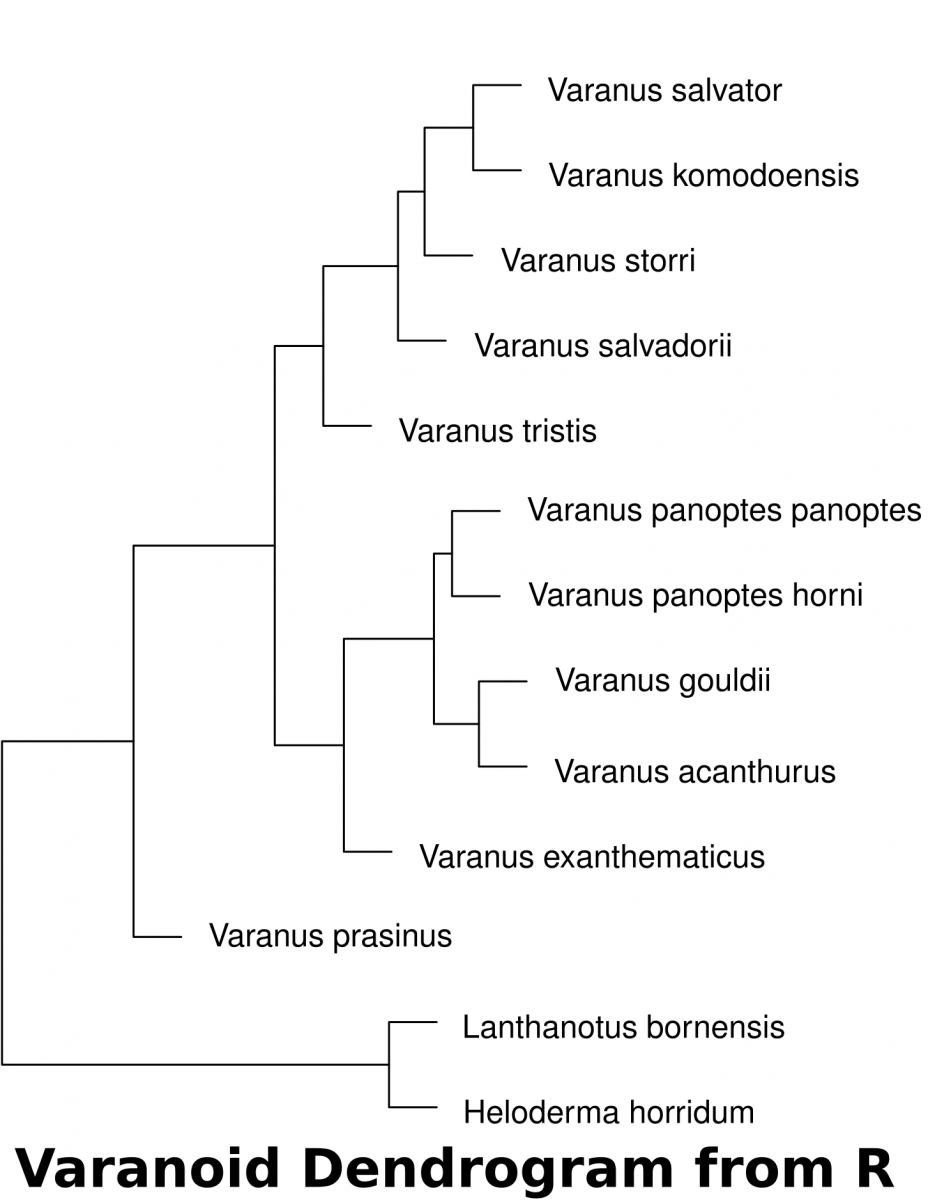
varanoid_cluster = hclust(dist_measure)
## open PDF as a graphics device to save a file in the '/tmp' directory
pdf(file='/tmp/varanoid_tree.pdf')
plot(varanoid_cluster)
dev.off()
## close the device to save the plot as pdf
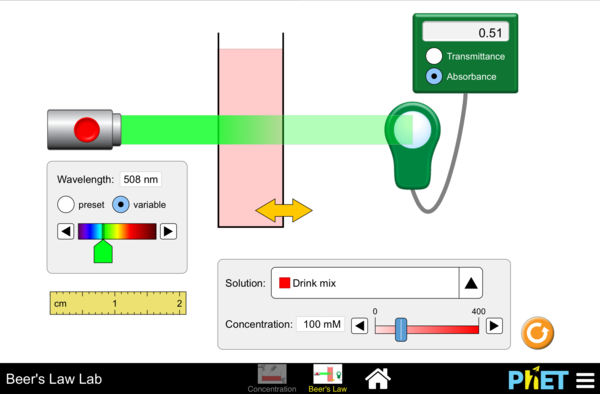
Use the link below to launch a simulation where you can alter the properties involved in spectrophotometry and examine the Beer-Lambert Law. Increase and decrease the concentration slider in the simulation:
What happens to the contents in the cuvette?
How does this change the Transmittance and Absorbance readings?
Click “variable” and use the slider. What happens to the readings when the Wavelength of the laser is a similar color as the solution in the cuvette?
Consult the color star below and find the color wavelength that is opposite of the color of the solution. Set the laser to this color using “variable” and the slider.
What is the effect on Transmittance and Absorbance with this color?
Using the previous observations (using variable wavelength slider), how would you use the relationship on Transmittance/Absorbance to best measure the concentration of a solution?
Click on image above to begin Beer’s Law Simulation
In Biological systems, energy is roughly defined as the capacity to do work. Molecules are held together by electrons. Breaking and building these bonds requires an input of energy. The energy needed to initiate such reactions is referred to as activation energy (EA). Sometimes the necessary energy to initiate a reaction is so great, that it greatly limits the likelihood of the reaction ever occurring. Catalysts are chemicals that take part in facilitating reactions by reducing the energy of activation. If the activation energy is reduced, the likelihood of a reaction occurring is greatly enhanced. In cells, the catalysts are often made of proteins and called enzymes.
Reaction coordinate of an exothermic reaction with and without an enzyme. The enzyme reduced the EA to facilitate the likelihood that the reaction occurs. This catabolic reaction breaks complex things down, thus increasing entropy and releasing energy into the system.
Enzymes
Reactants in enzymatic reactions are called substrates. They have an imperfect fit to a binding domain of the enzyme called the active site. Substrate binding to this active site induces a change in the shape of the protein that coordinates the substrate into a transition state that will reduce the amount of EA required for the reaction to go to completion. The induced fit of the protein also aids in coordinating other cofactors or coenzymes that will aid in the reaction.
Induced fit model of enzymes and substrates. The active site of the protein is an imperfect match for the substrate. Intermolecular interactions between the enzyme and substrate induce a new fit that facilitates the formation of a transition state and results in the catalysis of the reaction.
The reaction follows the standard flow where the Enzyme (E) and the Substrate (S) interact to form an Enzyme-Substrate Complex (ES). The ES then dissociates into Enzyme and the resultant Product (P)
E+S⇒ES⇒E+P
The induced fit of the enzyme-substrate complex coordinates the transition state to facilitate the reaction. This induced fit occurs through non-covalent means that result in a tugging on the molecules (an application of energy) while molecules are coaxed into the reactions.
Hexokinase enzyme interacts with an ATP and a hexose. These interactions alter slightly the structure of the enzyme (induced fit). This pulling on the enzyme and the substrates aids in catalyzing the reaction through coordinating the molecules, sometimes with the aid of cofactors and coenzymes. The yellow sphere represents the cofactor Mg2+Coenzymes can be covalently linked to amino acid side chains of the enzyme and are also referred to as prosthetic groups. While prosthetic groups are organic in nature, they may also involve the coordination of metal ions, like the heme group which binds to iron. These prosthetic groups enhance the repertoire of the amino acids to provide additional functioning to the entire protein. Early coenzymes were described as being vital to normal functioning and were characterized as organic molecules with amine groups. Because of this coincidence, they were referred to as vitamins (for vital amines) though not all vitamins have amine groups. The trace metal ions that work with these groups are also required and represent the minerals on food items.
Cryptozoology is a pseudoscience centered around the description of animals that have little or no evidence of existing. These mythical beasts include: Bigfoot, Yeti, Sasquatch, jackelope, Loch Ness Monster and chupacabra. Little evidence exist to illustrate their existence other than folklore.
Sightings of Bigfoot in North America.
Sometimes, physical evidence is left behind like hair or feces. With DNA evidence, we can help to confirm the existence of these unknown creatures. Below features a table from Sykes et al. displaying results on supposed cryptic Apes (Bigfoot/Yeti) and what DNA evidence has revealed them to be.
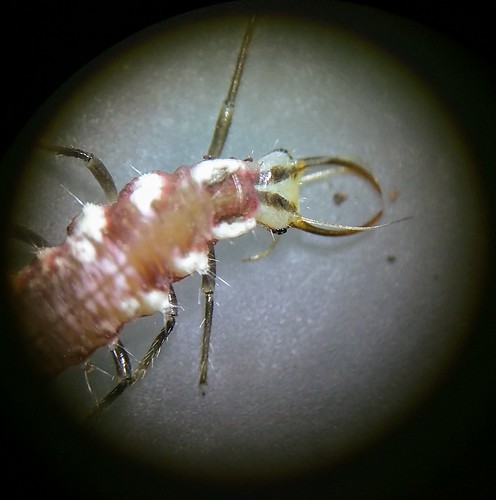
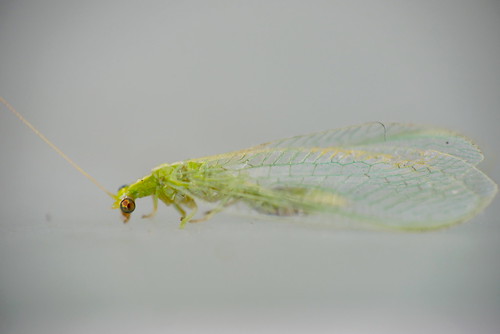
Taxonomy of living things was created by Carl von Linné, who formalized it by using a binomial classification system to differentiate organisms. Binomial nomenclature was used to describe a genus and a species name to each organism to provide an identity. These days, classification of organisms is becoming increasingly important as a measurement of diversity in the face of habitat destruction and global climate change. There is no consensus on how many life forms exist on this planet, but the estimation of extinction rates is about 1 species per 100-1000 million species. Classification in Linné’s day was mostly performed by morphological differences. This was carried on in fossils. However, morphology has many drawbacks, especially in sexually dimorphic species or species with multiple developmental morphologies.
Larva (top) of the Green Lacewing and the adult (bottom).
Molecular biology and DNA technologies have revolutionized the classification system of living things especially in providing the ability to match relatedness of these species. DNA barcoding, like the name implies, seeks to utilize DNA markers to differentially identify organisms. But what DNA markers should be used? What criteria do we use to develop barcodes? Discrimination, Universality and Robustness are the criteria used to define the usefulness of barcodes.
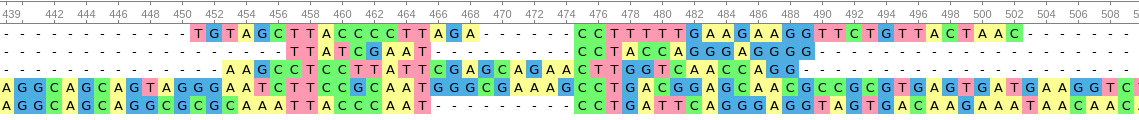
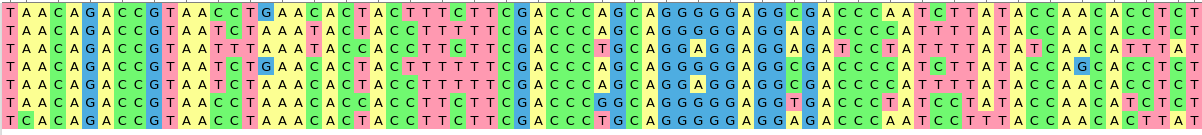
Since the goal of barcoding is to define specific organisms, discrimination is the primary objective. Discrimination refers to the difference of sequences that occur between species. However, science is easier when there is some universality in the locus used for discrimination. As it sounds, universality is an attempt to use the same locus in disparate genomes. While discrimination is about uniqueness of sequences, universality seeks to use a single set of PCR primers that will be able to amplify that same distinct region with variable sequence similarity. If some region of DNA has absolutely no sequence deviation between species, this has great universality but poor discrimination. But if a sequence has very low sequence similarity, this is great for discrimination but has absolutely no universality and can not be amplified with the same set of primers. Robustness refers to the reliability of PCR amplification of a region. Some regions of DNA just don’t amplify well or it is too difficult to design appropriate and unique primers for that locus.
A case where there is universality for designing primers, but not an area where discrimination can occur.While discrimination of different organisms can occur in this situation, the lack of similarity in sequence would make it difficult to design primers. That is, the lack of universality in sequence would also make this PCR not robust.Enough variability in these sequences gives us the ability to discriminate between species. The high similarity provides us the universality required to design primers that may be robust enough to amplify by PCR.
Sometimes, species are so similar for one sequence that a second marker is required. Just as the standard UPC barcode has a series of vertical line of different spacing and width, a 2-dimensional barcode adds that second dimension of information into a square of dots like in a QR code (Quick Response code). We can also utilize a second or a third or a fourth set of loci that will aid in increased discrimination just as CoDIS utilizes multiple STR sites to define individual people. In animals, the most commonly used barcode is the mitochondrial gene, Cytochrome Oxidase I (COI). Since all animals have mitochondria and have this mitochondrial gene, it offers high universality. It is a robust locus that is easy to amplify and has high copy number with enough sequence deviation between species to discriminate between them.
Animal mitochondrial genomes vary from 16kb-22kb. However, plants, fungi and protists have wildly different and larger mitochondrial genomes. For plants, we use a chloroplast gene, ribulose-bisphosphate carboxylase large subunit (rbcL) or maturase K (matK) (Hollingsworth et al. 2011). Prokaryotes are often discriminated by their 16s rRNA gene while eukaryotes can be identified by 18s rRNA. Because of hybrid animals (mules, ligers, coydogs, etc.), COI (a maternally transmitted gene) will not create a clear picture of species identity. sometimes, closely related species are also indistinguishable by a single barcode, so the inclusion of 18s with COI may be necessary to define the identity of the species. Since it is so difficult to meet the three criteria (robustness, universality and discrimination) for all species, having these multiple barcodes is important. Fungi prove to be difficult in identification by COI, so another marker called the internal transcribed spacer (ITS) is used to aid in their identification. We must also remember that not everything with chloroplasts are plants and therefore additional markers are used to identify protists.
Mixtures of organisms
Lichens are composite organisms composed of cyanobacteria or other algae with fungi. In this case, a single barcode would incorrectly identify the species.
Kefir granules represent colonies of mixed microbes that are used to generate kefir.A symbiotic colony of bacteria and yeast is used to ferment kombucha. As the name implies, this is a complex composite colony of multiple species that contribute to the qualities of the kombucha
Metabarcoding and Microbiomes
Class Results
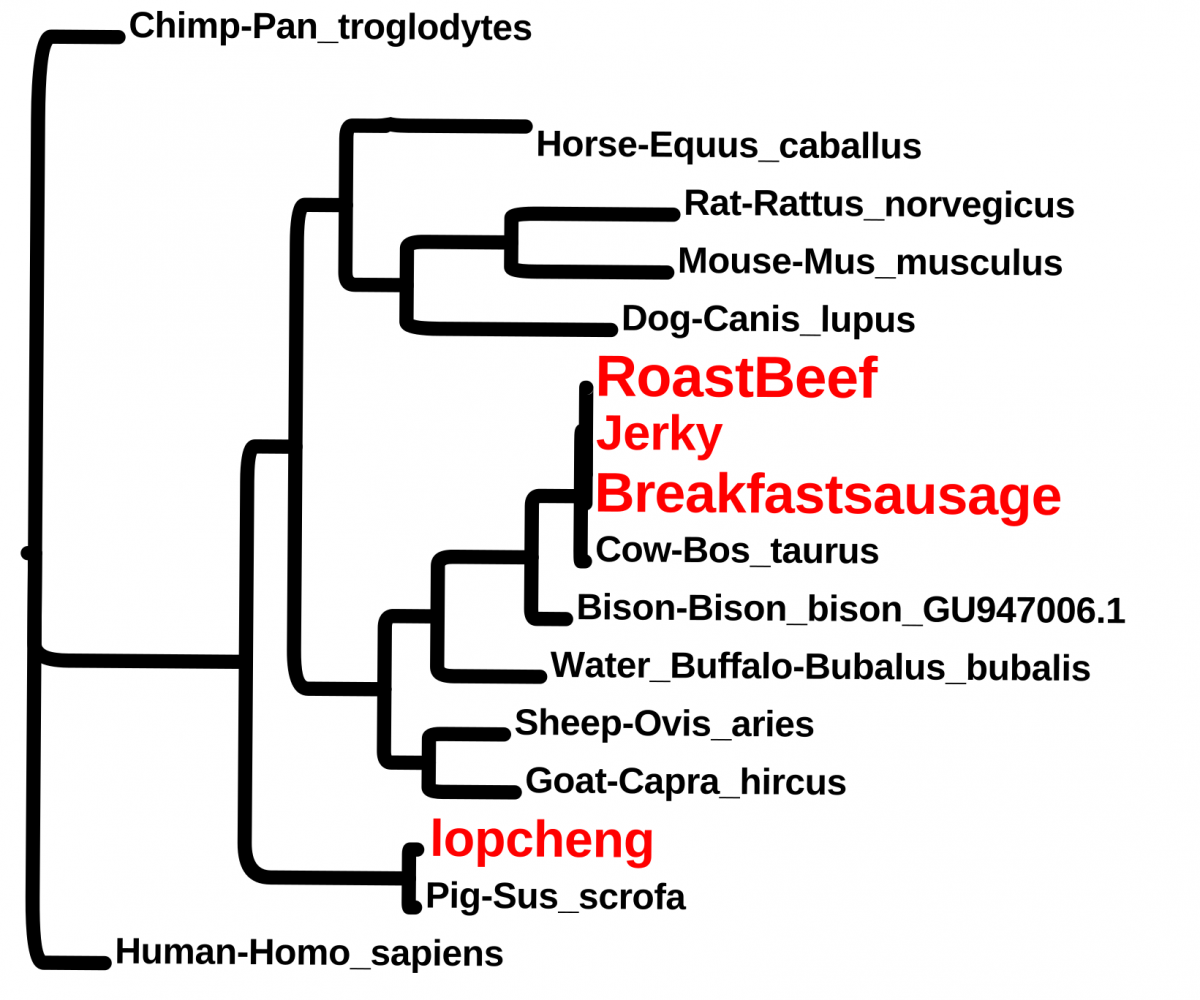
Students wanted to check some food items. These included, breakfast sausage from a Halal cart, “beef jerky” from the vending machine, roast beef from the cafeteria and a Chinese sausage (lopcheng).
Drawings dating to approximately 30,000 years ago in the Chauvet CaveWhat constitutes being human? Many will point at a cultural identity and leaving long-standing remnants of that culture. Such prehistorical artifacts like cave drawings and tools provide an anthropological framework for identifying what it is to be human, but the biological identity remains locked in the history of our DNA.
Spear points of the Clovis Culture in the Americas dating to approximately 13,000 years ago.
The Great Apes
Phylogenetic tree generated with Cytochrome Oxidase I (COI) genes.
Homo sapiens represent a branch of primates in the line of Great Apes. The family of Great Apes consists of four extant genera: Homo, Pan, Gorilla, Pongo. Karyotype analysis (Yunis et al., 1982) reveals a shared genomic structure between the Great Apes. While humans have 46 chromosomes, the other Great Apes have 48. Molecular evidence at the DNA level indicates that Human Chromosome 2 is a fusion of 2 individual chromosomes. In the other Great Apes, these 2 Chromosomes are referred to as 2p and 2q to illustrate their synteny to the human counterpart.
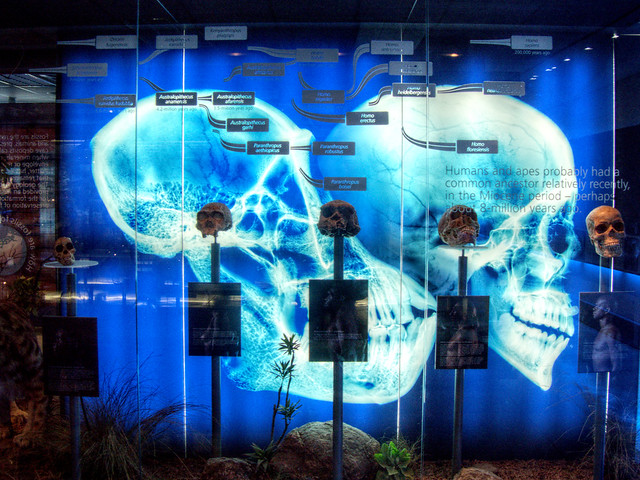
The Pan-Homo divergence. A display at the Cradle of Humankind illuminates the skulls of two extant Hominini with a series of model fossils from the Hominina subtribe of Austrolopithecina and Homo
Chimpanzees (Pan) are the closest living relatives to modern humans. It is commonly cited that less than 2% differences in their nucleotide sequences exist with humans (Chimpanzee Sequencing and Analysis Consortium, 2005). More recent findings in comparing the complement of genes (including duplication and gene loss events) now describes the difference in genomes at about 6% (Demuth JP, et al., 2006).
The Genus Homo
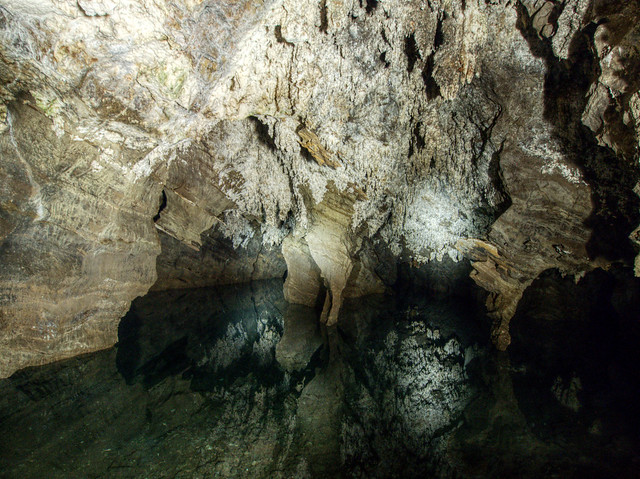
An underground lake at inside the Sterkfontein Cave system at the Cradle of Humankind (South Africa)
The rise of the human lineage is thought to arise in Africa. Fossils of Austroloptihs (southern apes) found in death traps, like those at the Cradle of Humankind, reveal a historical record of organisms inhabiting the landscape. The breaks in the ceiling of the caves provide opportunities for animals to fall inside these caves to their death. The limestone deposits of the caves serve as an environment for fossilization and mineralization of their remains. An abundance of fossilized hominids in these caves including Australopithecus africanus, Australopithecus prometheus, Paranthropus boisei, and the newly discovered Homo naledi continue to reveal the natural history of the genus Homo from 2.6 million to 200,000 years ago.
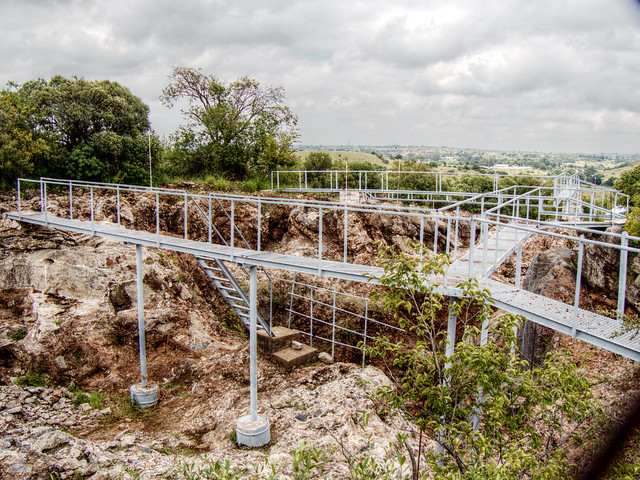
The entrance to the archaeological site at Sterkfontein, Cradle of Humankind (South Africa).
Ancient DNA of Humans
In 2008, a piece of a finger bone and a molar from a Siberian Cave were found that differed slightly from that of modern humans. The cave, called Denisova Cave, maintains an average temperature of 0ºC year round and was suspected to contain viable soft tissue. Bones in this cave were discovered that had similarities to modern humans and Neandertals. An initial mitochondrial DNA analysis revealed that these beings represented a distinct line of humans that overlapped with them in time (Krause et al., 2010). Analysis of the full nuclear genome followed and indicated that interbreeding existed between these Denisovans, Neandertals and modern humans (Reich et al., 2010). Furthermore, analysis of DNA from a 400,000 year old femur in Spain revealed that these three lines diverged from the species Homo heidelbergensis and that Denisovans were closest in sequence (Meyer et al., 2016).
Between modern humans, markers found in the mtDNA can be used to trace the migrations and origins along the maternal line. Similarly, VNTRs found on the Y chromosome have revealed migration patterns along paternal lines within men. Other markers, like the insertion points of transposable elements can be used to further describe the genetics and inheritance of modern humans while providing a snapshot into evolutionary history.
Yunis JJ, Prakash O. The origin of man: a chromosomal pictorial legacy. Science. 1982 Mar 19;215(4539):1525-30.
Chimpanzee Sequencing and Analysis Consortium. Initial sequence of the chimpanzee genome and comparison with the human genome. Nature. 2005 Sep 1;437(7055):69-87.
Krause, Johannes; Fu, Qiaomei; Good, Jeffrey M.; Viola, Bence; Shunkov, Michael V.; Derevianko, Anatoli P. & Pääbo, Svante (2010), “The complete mitochondrial DNA genome of an unknown hominin from southern Siberia”, Nature, 464 (7290): 894–897, doi:10.1038/nature08976, PMID 20336068
Reich, David; Green, Richard E.; Kircher, Martin; Krause, Johannes; Patterson, Nick; Durand, Eric Y.; Viola, Bence; Briggs, Adrian W. & Stenzel, Udo (2010), “Genetic history of an archaic hominin group from Denisova Cave in Siberia”, Nature, 468 (7327): 1053–1060, doi:10.1038/nature09710, PMID 21179161
Escherichia coli are commensal gram negative bacteria found in the guts of humans. They have the capacity to double every twenty minutes and make a favorable carrier of recombinant DNA. Plasmid DNA can be introduced into E. coli easily after making them competent. One method to achieve this is through chemical competence with heat shock. In this process, the bacteria are incubated in CaCl2 solution on ice. The cold serves to slow down molecular motion of the plasma membrane while the Ca2+ ions remove the charge-charge repulsion between the phospholipids and the negatively charged DNA seeking to gain entry into the cell. Cells are placed for a short period of time at 42°C to induce heat shock. This heat shock results in the cell taking up the DNA. This method is very low efficiency so many bacteria do not take in any DNA. Cells are allowed to recover from heat shock at 37°C in rich nutrient broth to allow for the production of the antibiotic resistance proteins encoded on the vector as a selection marker. Transformed cells are then spread across an agar plate containing the antibiotic which will then kill all non-transformed cells. Only the bacteria containing the vector with the antibiotic resistance gene will survive and replicate to form small colonies on the surface of the agar.
Exercise: Transformation of Bacteria with RE Identified Plasmids
Each group retrieves the 2 miniprepped plasmids from the previous week in the freezer and allow to thaw on ice.
Bring 2 agar plates to room temperature
2 plates will contain antibiotic, X-Gal and arabinose
For each plasmid, obtain 250μl of transformation buffer (50mM CaCl2) in microfuge tubes and place on ice for 10 minutes
Take an inoculating loop and remove a single colony of bacteria from a freshly streaked plate grown overnight
Swirl bacteria in each tube containing transforming solution to distribute bacteria throughout solution
Pipette 5 μl of plasmid into the tube and incubate on ice for 10 minutes
During this incubation, flip the warmed plates and label them with your group names.
Place transformation tubes into 42°C heatblock for 1 minute to heat shock the cells
Add 500μl fresh SOC media (or LB) and incubate at 37°C for 15 minutes.
Pipette 150μl of transformation solution onto each plate and spread across the plate.
Turn plates agar side up and place them into 37°C incubator overnight. (your instructor will retrieve them and place them into refrigerator)
Hypothesize: What will I expect of my transformed cells?
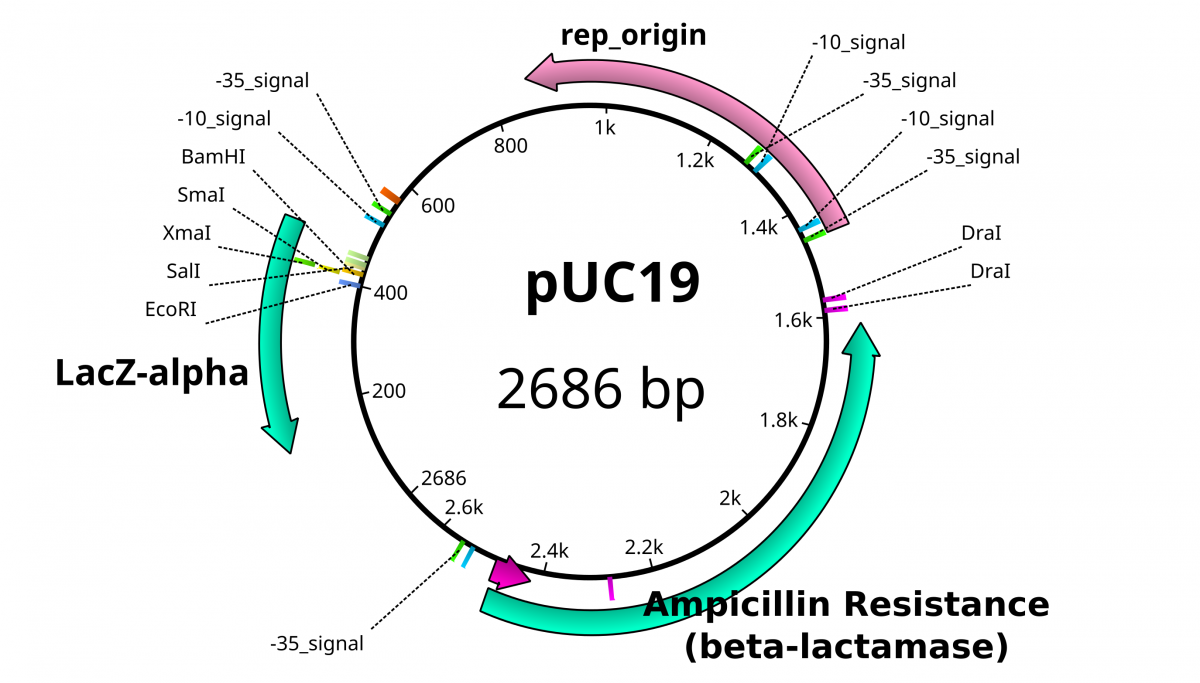
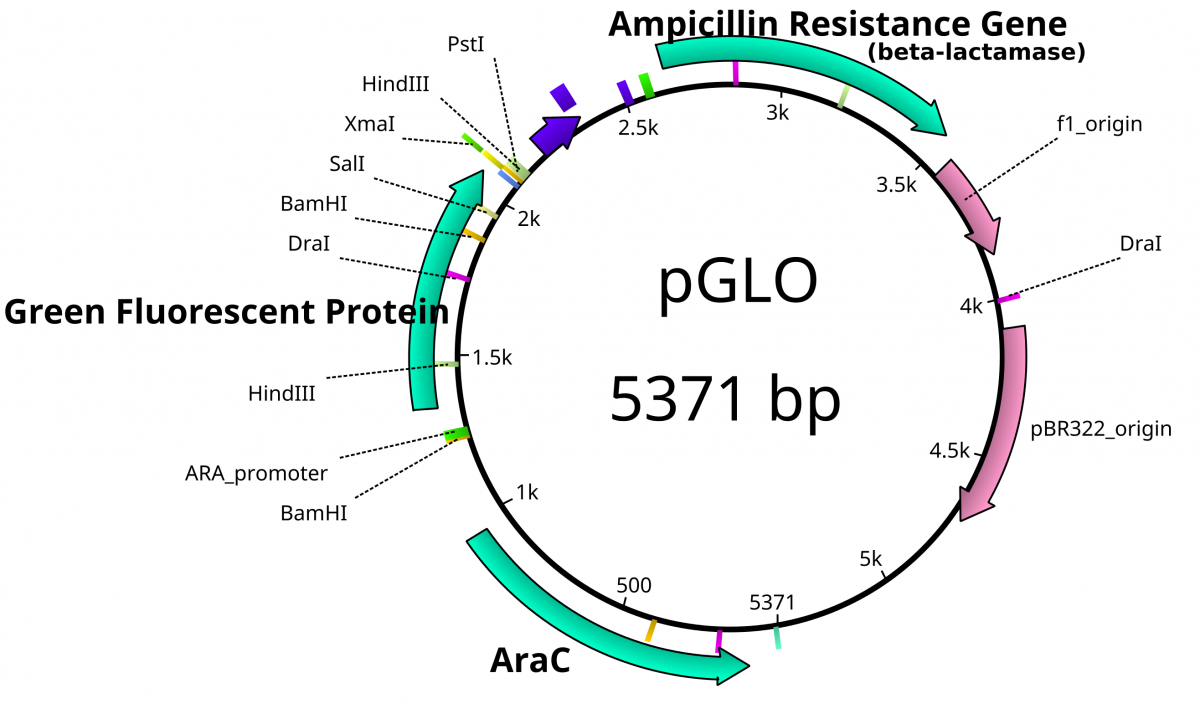
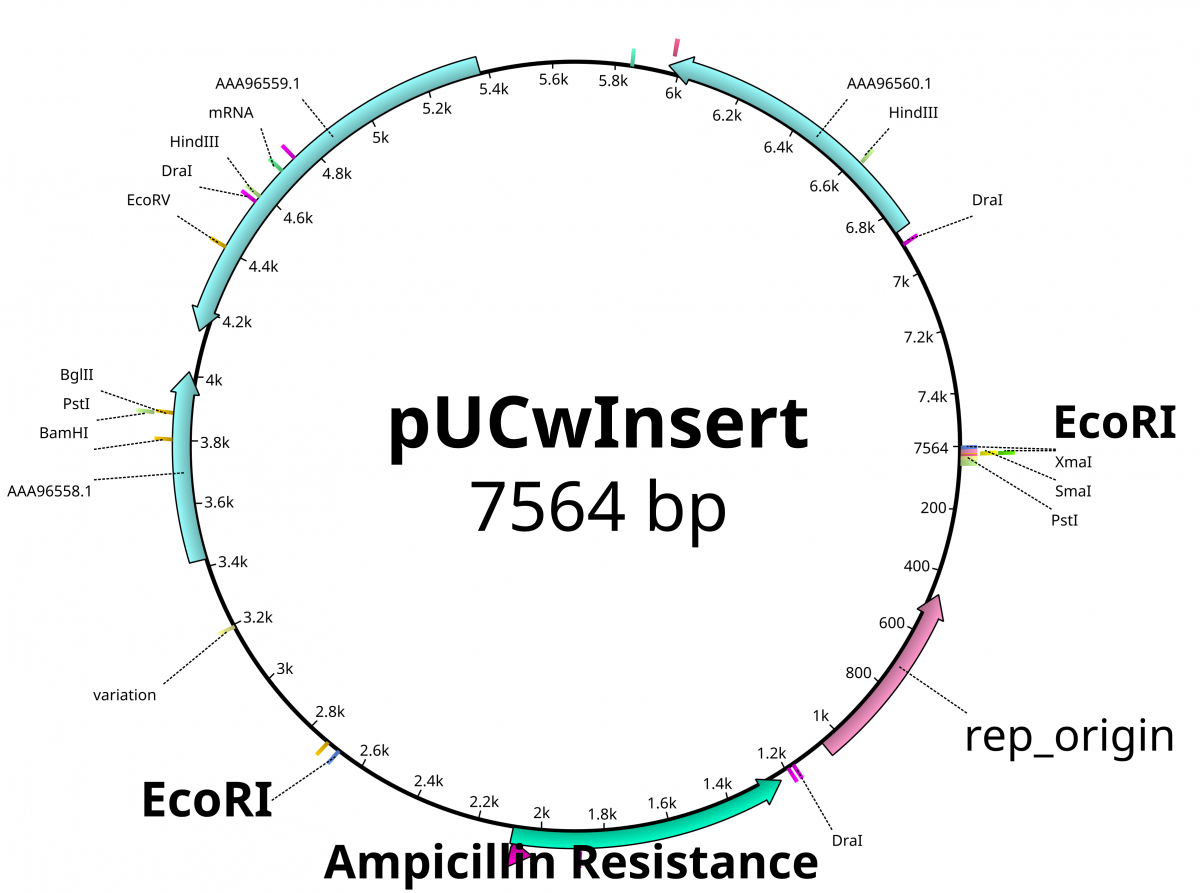
From the previous lab, we can identify our plasmids. The plasmids are either pGlo, pUC18/19 or pUC18/19 with a 6kb insert disrupting the LacZ gene. pGlo contains a gene that encodes the protein GFP that will fluoresce green under UV light and is 5.4kb. pUC is typically 2.7kb in size. LacZ is a gene encoding the protein β-Galactosidase, the enzyme that hydrolyzes lactose into the monosaccharides galactose and glucose. X-Gal is a chemical resembling lactose, however upon hydrolysis, the molecule deposits a blue coloring into the cell.


 [GFDL (http://www.gnu.org/copyleft/fdl.html) or CC-BY-SA-3.0 (http://creativecommons.org/licenses/by-sa/3.0/)], via Wikimedia Commons")


") and
and ")

 .
.
 and
and 

 = \sqrt{\sum_{k=1}^{p}(X_{ik} - X_{jk})^2}\")

 [GFDL (http://www.gnu.org/copyleft/fdl.html) or CC-BY-SA-3.0 (http://creativecommons.org/licenses/by-sa/3.0/)], via Wikimedia Commons")


.jpg)