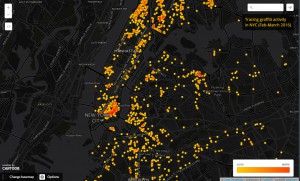
It was enthralling to learn both about the genesis of GIS and the concurrent application of GIS. Although we did not use GIS on Thursday, we learned the basics on how to use a similar system called CartoDB. Above is screenshot of a map I had made from the website, which aims to study the pattern of graffiti complaints in NYC for the past month.
Both GIS and Cartodb function from a database in which information can be extracted to formulate visual representations. Visual representation or aids can facilitate different methods of analysis, or learning which are highly applicable for research and planning methodologies. While the art of mapping has started in the 1700’s, GIS has enabled multidisciplinary fields to track information in gratifying ways since the 1980’s.
Information can be understood in a series of plots, shapes or colors that in the context of the map, creates a new form of investigation. New patterns are plotted on a map, which are endless: they can can either be topography of a place, which is helpful for landscape architects, for tracking traffic accidents, which is helpful for transportation planners, for studying income brackets in a neighborhood, which is helpful for urban planners, and even for studying crime, which is helpful for the police force. All these possibilities make me feel quite fortunate to have access to these tools, as there is an endless sea of open databases on the web.


