Contents
Experimental Background
Bovine Serum Albumin (BSA) is a protein that circulates in the blood of cows. Purified BSA can be used with Biuret solution in serial dilutions to generate a Standard Curve. The standard curve will illustrate the relationship between concentration (the dependent variable) and absorbance at 540 nm (the independent variable). We can then use this curve to estimate the concentration of unkown samples.
- On a graph, do you remember which axis is the dependent and which is the independent variable?
- In the table below, can you identify which samples are the negative controls and which are the positive controls?
- What is the prediction of the absorbance or color intensity of the different tubes?
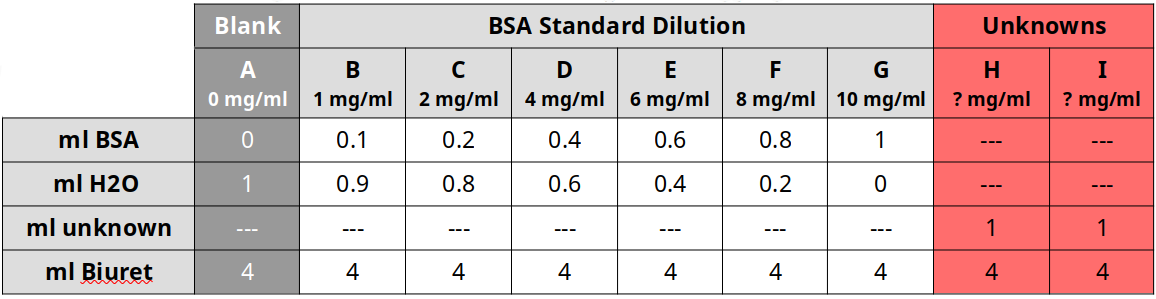
Dilute BSA Standards
- Label 9 tubes 1-9
- Combine the components of the table below to generate appropriate concentration of solutions
- Place tube 1 (1mg/ml) into a cuvette for measuring absorbance (A) in the SpectroVis Plus. This will find the peak absorbance value.
- The instructor will begin to set-up the units for distribution
- Enter the LabQuest 2 application and press on the green Start button to generate a full spectrum
- tap on the file cabinet icon to store this data
- On the Meter Screen, tap on Mode
- Change the mode to “Events with Entry”
- Enter the Name: Concentration
- Enter Units: mg/ml
- Select OK
- If message appears about saving run, choose Discard
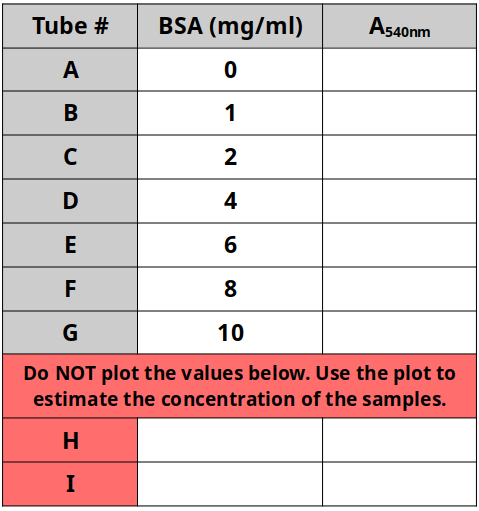
- Sequentially read each sample at the stored wavelength (between A540nm-A600nm) and record values in table below
- Plot each BSA dilution in plot.ly as a scatterplot
- Generate best-fit line for these standards with the equation of the line
- Use the equation of the line to estimate the concentration of the unknown sample.
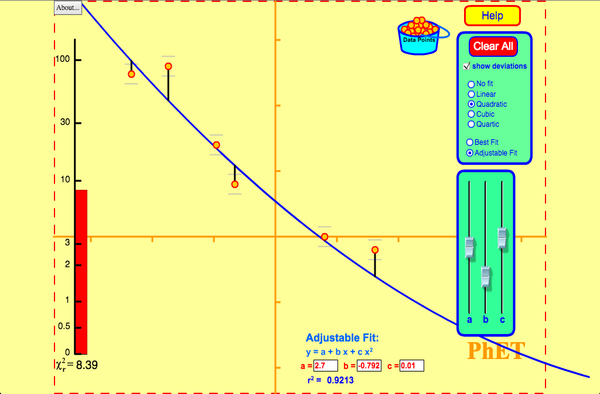
Curve Fitting
Run the simulation below to understand how you can use the standard dilution series to estimate your sample concentrations.
LabQuest2 and SpectroVis Tutorial
Scatterplot Tutorial
You can watch this tutorial at 1.25X and pause when needed.
Tags: quantitative reasoning

