Contents [hide]
Quantitative PCR (qPCR)
Measurements can be made of individual genes of interest through PCR of those specific genes. A process known as Real-Time PCR or quantitative PCR (qPCR) is used to measure individual genes using fluorescence measurements. An intercalating agent that binds only to double stranded DNA called Sybr Green is used in a qPCR machine that is measuring fluorescence after each cycle of PCR indirectly indicates the amount of amplified product. However, non-specific products of amplification may also be measured and not discriminated from the authentic amplicon.
An alternative to Sybr Green is exemplified by the TaqMan technology. With TaqMan, a third primer (TaqMan probe) is designed in the middle of the area to be amplified. This middle primer is designed with a hairpin self-complimentarity so that the 5′ and 3′ ends are in close proximity. At one end, a fluorescent reporter is attached while the other terminus has a quencher that absorbs any fluorescence signal. Under normal circumstances, measurements of fluorescence will be very low. When PCR extension occurs, the Polymerase hydrolyzes this middle primer, thereby separating the quencher and reporter. The name TaqMan is a play on words since it is imagined that the polymerase is chewing up the probe like Pacman. With increased distance between quencher/reporter, fluorescence signal from this probe can now be measured. This method is much more specific than Sybr Green, however the use of specific probes increases the cost considerably.
Threshold Cycles (Ct)
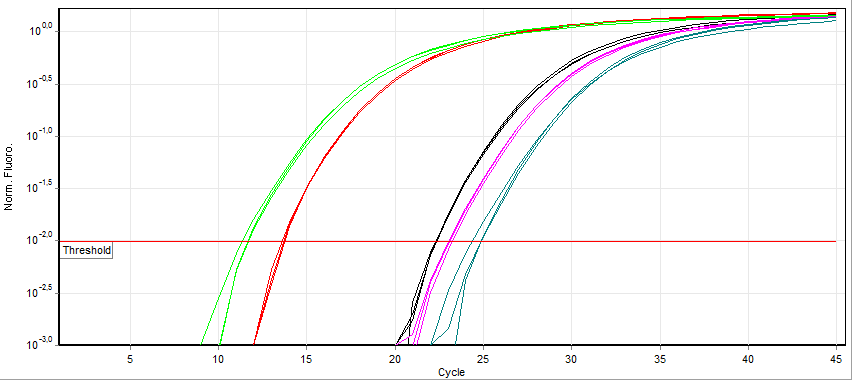
Fluorescence measurement early during the PCR process will be very low due to small number of dsDNA molecules (Sybr Green) or most TaqMan primers being quenched. During this exponential DNA production, a threshold will be reached in which the fluorescence will linearly increase. A specific point where the fluorescence is clearly measurable called the Threshold Cycle (Ct) is used as a reference point to compare expression values.

Looking at the example of Sybr Green qPCR above, it can be observed that samples exponentially increasing at a lower Cycle number (Ct) has a higher level of mRNA expression (towards the left) of that gene than samples with higher cycle number (towards the right). Notice that the fluorescence eventually plateaus and stops increasing. This is due to the depletion of raw materials for DNA production like dNTPs.
Since the PCR reactions theoretically represent a doubling of DNA after each cycle, the Ct values can be interpreted on a base 2 system. If there is a difference in Ct between two samples (ΔCt) of 5 cycles, this corresponds to 25 or 32 fold difference. We can control for variations in the RNA preparation through comparing the fluorescence values of our gene of interest to a housekeeping gene like actin. The use of a house-keeping gene to normalize the initial input to the reactions and comparison between samples is referred to as Relative Quantification.
Melt Curves for Sybr Green


Any peaks in this plot refer to a specific PCR product. If multiple peaks appear, the results will not be valid as they do not directly measure a single product.
Expression measurements
Differential gene expression refers to transcriptional programs activated by the cell under various conditions. “Differential” refers to a comparison of two or more states or timepoints. Using mRNA as an indirect measurement of protein, one can ascertain which proteins are linked to these different states. In eukaryotes, this can be assessed by enriching total RNA for polyA-containing mature mRNA. Through the use of oligo-(dT) containing resin, mRNA can be separated from non-protein encoding RNA. Likewise, performing a reverse-transcription using an oligo-(dT) primer will create a stable complimentary DNA (cDNA) molecule that can be used with PCR. Using qPCR in this way is called RT-PCR or reverse-transcription polymerase chain reaction where specific primer pairs are used to amplify a small portion of a known gene.
Hybridization based methods and Microarrays
Prior to RT-PCR, expression of individual genes was assessed through a hybridization-based approach. This method called for running RNA on an agarose gel and transferring the size-fractionated RNAs onto a membrane through a method called “blotting”. This transferred RNA was then hybridized to a radioactively labelled probe for a specific gene (corresponding to the reverse complimentary sequence) and visualized by exposure to X-ray film in a process called Northern Blotting. The intensity of the band would be proportional to the amount of mRNA corresponding to the gene of interest. Re-probing with a housekeeping gene like actin would be used as a loading control to illustrate that a similar amount of total RNA was loaded into each well. Differences in sizes of the mRNA on the Northern Blot also revealed differences in splice variants of mature mRNA in the different states.

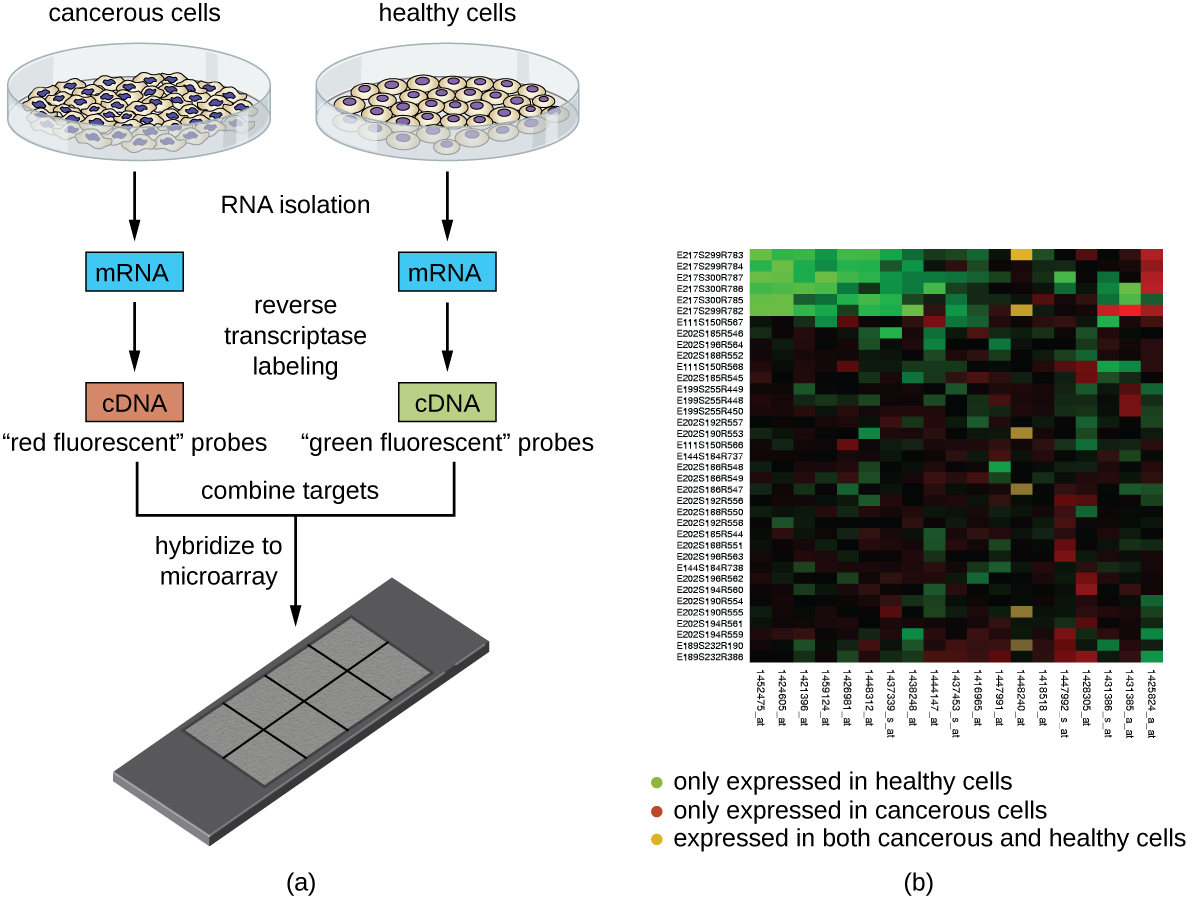
This technique was later adapted using non-radioactive methods. Using these non-radioactive methods, the reverse protocol was developed to measure multiple gene targets. By systematically immobilizing gene specific probes onto a membrane or a microscope slide, an array of targets can be produced. In the simplest paradigm of having 2 states (control or experimental), cDNA from each sample can be used to generate fluorescent RNA that can hybridize to immobilized probes. Using 2 different fluorescent markers allows for the competitive hybridization onto the array whereby the fluorescent signal in each channel can reveal the differential gene expression of the two states in a 2-color microarray.

Tags: quantitative reasoning, integration of knowledge


