Entertainment Project Management

Project Management in Live Entertainment

  • Project Profile
  • Home
  • Instructions
    • syllabus
    • Course Schedule
    • Production calendar link
    • Online etiquette
    • How to do Citations
  • Lecture Content
    • Project Management 101
    • Excel 101
    • How to Estimate
    • Meet an estimator and WBS Charts
    • Estimating Project Presentation Day and PERT Charts
    • Proposal part 1
    • Reading executive summaries
    • Proposal part 2
    • Poster Preparation
    • Final project lecture 1
    • Defining the Tour lecture 2
    • Final project understanding contracts
    • Obstacle assignments
  • Projects
    • Writing assignments
      • Ted Talk 1
      • Ted Talk 2
      • Ted Talk 3
      • Ted Talk 4
      • Ted Talk 5
      • TED TALK 6
    • Estimating project the Boiler
    • Proposal project
    • Poster Project
    • Final project version 2
  • Tools
    • Culmination preparation
    • Excel Spreadsheets
    • Executive Summary
    • GANTT Chart
    • People skills
    • PERT Chart
    • Work breakdown structure
    • Draw.io workshop
  • Faculty
City Tech OpenLab > Entertainment Project Management > GANTT Chart

GANTT Chart

Henry Laurence Gantt (1861-1919) was a mechanical engineer, management consultant and industry advisor. He developed Gantt charts in the second decade of the 20th century as a visual tool to show how projects are scheduled and actual progress of projects. Gantt charts were first used on large construction projects like the Hoover Dam in 1931 and the interstate highway network which started in 1956.  Download Organizing for Work, a book by Henry Gantt. I suggest reading Henry Gantt’s book as it is an interesting view into the world of how businesses began to work and operate with the influence of industrialism in the 1920’s. The ideas he discusses are applicable to todays world.  The book is free and available to all. It was published the year he died.

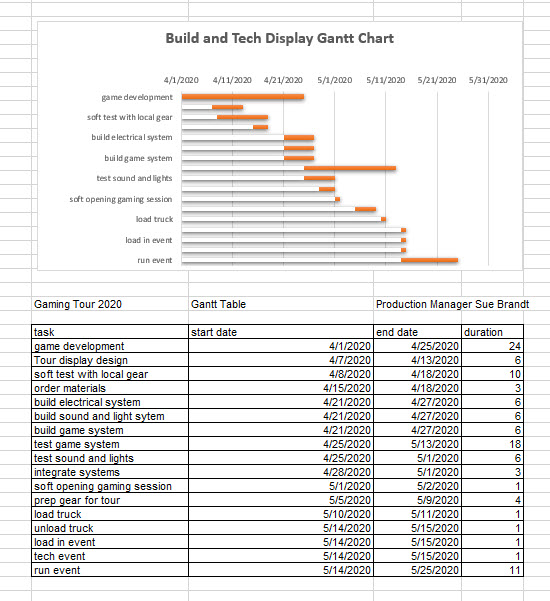
When you present a Gantt chart be sure to also include the table you made to create the chart in your presentation. The Gantt chart below is presenting the build and tech of an interactive gaming display. The Gantt table can be adjusted as the project is happening the chart then updates presents current progress of the project. The Gantt chart enables the production manager to present the progress of the project at meetings with their client.

The best tool to use is the timeline tool. First open excel and create your table. Second open the timeline tool using the link below. Follow the instructions when asked upload your excel file that has your table. Follow the remaining instructions. Save your file and export the outcome as a jpg you can embed in your document with the table.

Timeline tool for making a Gantt chart


Video Tutorials for MS Word and Excel

How to make a Gant chart from scratch using word and excel
How-to-make-a-Gantt-chart-in-ExcelDownload

License

Attribution-NonCommercial-ShareAlike (CC BY-NC-SA)

Unless otherwise noted, this site by sbrandt has a Creative Commons Attribution-NonCommercial-ShareAlike (CC BY-NC-SA) license. Learn more.

Creative Commons License
This header image take by Ryoya Terao is licensed under a Creative Commons Attribution-ShareAlike 4.0 International License.

Education Pro Theme on Genesis Framework · WordPress · Log in

The OpenLab at City Tech:A place to learn, work, and share

The OpenLab is an open-source, digital platform designed to support teaching and learning at City Tech (New York City College of Technology), and to promote student and faculty engagement in the intellectual and social life of the college community.

New York City College of Technology City University of New York

New York City College of Technology | City University of New York

Support

Help | Contact Us | Privacy Policy | Terms of Use | Credits

Accessibility

Our goal is to make the OpenLab accessible for all users.

Learn more about accessibility on the OpenLab

Copyright

Creative Commons

  • - Attribution
  • - NonCommercial
  • - ShareAlike
Creative Commons

© New York City College of Technology | City University of New York


top

The OpenLab at City Tech:A place to learn, work, and share

The OpenLab is an open-source, digital platform designed to support teaching and learning at City Tech (New York City College of Technology), and to promote student and faculty engagement in the intellectual and social life of the college community.

New York City College of Technology City University of New York

New York City College of Technology | City University of New York

Support

Help | Contact Us | Privacy Policy | Terms of Use | Credits

Accessibility

Our goal is to make the OpenLab accessible for all users.

Learn more about accessibility on the OpenLab

Copyright

Creative Commons

  • - Attribution
  • - NonCommercial
  • - ShareAlike
Creative Commons

© New York City College of Technology | City University of New York

Entertainment Project Management
Skip to toolbar
  • OpenLab Logo
    • Home
    • About
    • People
    • Courses
    • Projects
    • Clubs
    • Portfolios
    • Help
  • My OpenLab
    • Home
    • About
    • People
    • Courses
    • Projects
    • Clubs
    • Portfolios
    • Help
  • Sign Up
  • Log In