Entertainment Project Management

Project Management in Live Entertainment

  • Project Profile
  • Home
  • Instructions
    • syllabus
    • Course Schedule
    • Production calendar link
    • Online etiquette
    • How to do Citations
  • Lecture Content
    • Project Management 101
    • Excel 101
    • How to Estimate
    • Meet an estimator and WBS Charts
    • Estimating Project Presentation Day and PERT Charts
    • Proposal part 1
    • Reading executive summaries
    • Proposal part 2
    • Poster Preparation
    • Final project lecture 1
    • Defining the Tour lecture 2
    • Final project understanding contracts
    • Obstacle assignments
  • Projects
    • Writing assignments
      • Ted Talk 1
      • Ted Talk 2
      • Ted Talk 3
      • Ted Talk 4
      • Ted Talk 5
      • TED TALK 6
    • Estimating project the Boiler
    • Proposal project
    • Poster Project
    • Final project version 2
  • Tools
    • Culmination preparation
    • Excel Spreadsheets
    • Executive Summary
    • GANTT Chart
    • People skills
    • PERT Chart
    • Work breakdown structure
    • Draw.io workshop
  • Faculty
City Tech OpenLab > Entertainment Project Management > Estimating Project Presentation Day and PERT Charts

Estimating Project Presentation Day and PERT Charts

Contents

  • 1 Estimating Project Outcomes Discussion
  • 2 Program Evaluation Review Technique  or PERT Charts
    • 2.1 KEY TAKEAWAYS
    • 2.2 Interpreting PERT Charts
    • 2.3 The Benefits of PERT Charts
    • 2.4 How to make a PERT chart lecture is in the tools tab.

Estimating Project Outcomes Discussion

Today everyone should be prepared to discuss the outcomes and budget estimates for your Estimating assignment. It is important to turn the assignment in ontime as we will be using a chart to compare your numbers.

Program Evaluation Review Technique  or PERT Charts

When the discussion is done we will spend the remainder of class learning how to make PERT charts and everyone will create a PERT chart base on your estimating assignment.

KEY TAKEAWAYS

  • PERT charts were first created by the U.S. Navy’s Special Projects Office in 1957 to guide the Polaris nuclear submarine project.
  • A PERT chart uses circles or rectangles called nodes to represent project events or milestones. These nodes are linked by vectors, or lines, that represent various tasks.
  • A PERT chart allows managers to evaluate the time and resources necessary to manage a project.

A PERT chart uses circles or rectangles called nodes to represent project events or milestones. These nodes are linked by vectors or lines that represent various tasks. Dependent tasks are items that must be performed in a specific manner. For example, if an arrow is drawn from Task No. 1 to Task No. 2 on a PERT chart, Task No. 1 must be completed before work on Task No. 2 begins Items at the same stage of production but on different task lines within a project are referred to as parallel tasks. They’re independent of each other, but they’re planned to occur at the same time.

Interpreting PERT Charts

A PERT chart is a graphic representation of a series of activities that must occur within a project’s timeline. The direction of arrows indicates the progression and cycle of tasks required for project completion. Dotted activity lines represent dummy activities—items that are located on another PERT path. Numbers and time allotments are assigned and shown inside each vector.

The Benefits of PERT Charts

A PERT chart allows managers to evaluate the time and resources necessary to manage a project. This evaluation includes the ability to track outcomes during any stage of production in the course of the entire project. . Understanding the dependencies concerning the flow of project allows management to achieve the most efficient and useful project path.

How to make a PERT chart lecture is in the tools tab.

Source: http://searchsoftwarequality.techtarget.com/definition/PERT-chart

Take the PERT chart quiz on blackboard in the assignments tab, estimating and charts file, pert quiz icon.

PERT chart vocabulary

PERT table for the Boiler project

Boiler-pert-table-2023Download

First we will create a chart together using the PERT chart handout. Second you will meet with your team and create a PERT chart using the table below. The table is also inside the handout for ease of use.

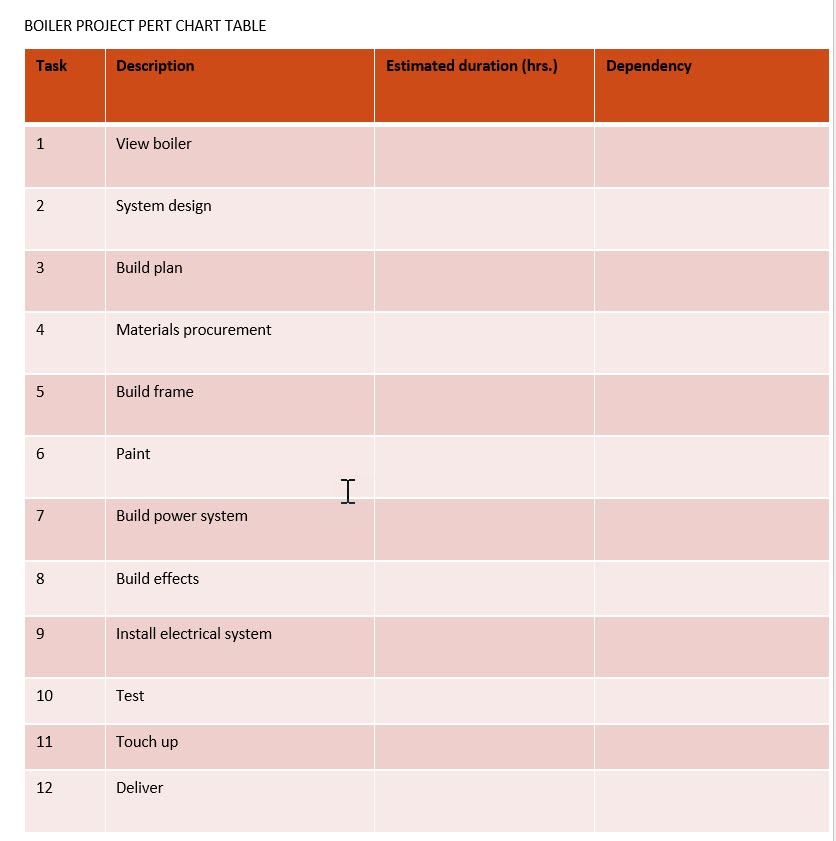
We are going to draw one chart together. Next the class will break into teams and draw their own pert chart for the boiler project using the tables in the pert chart hand out.

PERT chart Grading Rubric

DescriptionIgnored=0idea attempted=750% complete= 12.5100%=25
PERT Tabledrawnlabeledcomplete
PERT Chartdrawnlabeledcomplete
critical pathdrawnlabeledtime calculated
Chart labeled correctlyproject namePM namecontent labels

Turn in on blackboard in the assignments tab, estimating and charts file, pert chart project icon.

License

Attribution-NonCommercial-ShareAlike (CC BY-NC-SA)

Unless otherwise noted, this site by sbrandt has a Creative Commons Attribution-NonCommercial-ShareAlike (CC BY-NC-SA) license. Learn more.

Creative Commons License
This header image take by Ryoya Terao is licensed under a Creative Commons Attribution-ShareAlike 4.0 International License.

Education Pro Theme on Genesis Framework · WordPress · Log in

The OpenLab at City Tech:A place to learn, work, and share

The OpenLab is an open-source, digital platform designed to support teaching and learning at City Tech (New York City College of Technology), and to promote student and faculty engagement in the intellectual and social life of the college community.

New York City College of Technology City University of New York

New York City College of Technology | City University of New York

Support

Help | Contact Us | Privacy Policy | Terms of Use | Credits

Accessibility

Our goal is to make the OpenLab accessible for all users.

Learn more about accessibility on the OpenLab

Copyright

Creative Commons

  • - Attribution
  • - NonCommercial
  • - ShareAlike
Creative Commons

© New York City College of Technology | City University of New York


top

The OpenLab at City Tech:A place to learn, work, and share

The OpenLab is an open-source, digital platform designed to support teaching and learning at City Tech (New York City College of Technology), and to promote student and faculty engagement in the intellectual and social life of the college community.

New York City College of Technology City University of New York

New York City College of Technology | City University of New York

Support

Help | Contact Us | Privacy Policy | Terms of Use | Credits

Accessibility

Our goal is to make the OpenLab accessible for all users.

Learn more about accessibility on the OpenLab

Copyright

Creative Commons

  • - Attribution
  • - NonCommercial
  • - ShareAlike
Creative Commons

© New York City College of Technology | City University of New York

Entertainment Project Management
Skip to toolbar
  • OpenLab Logo
    • Home
    • About
    • People
    • Courses
    • Projects
    • Clubs
    • Portfolios
    • Help
  • My OpenLab
    • Home
    • About
    • People
    • Courses
    • Projects
    • Clubs
    • Portfolios
    • Help
  • Sign Up
  • Log In