
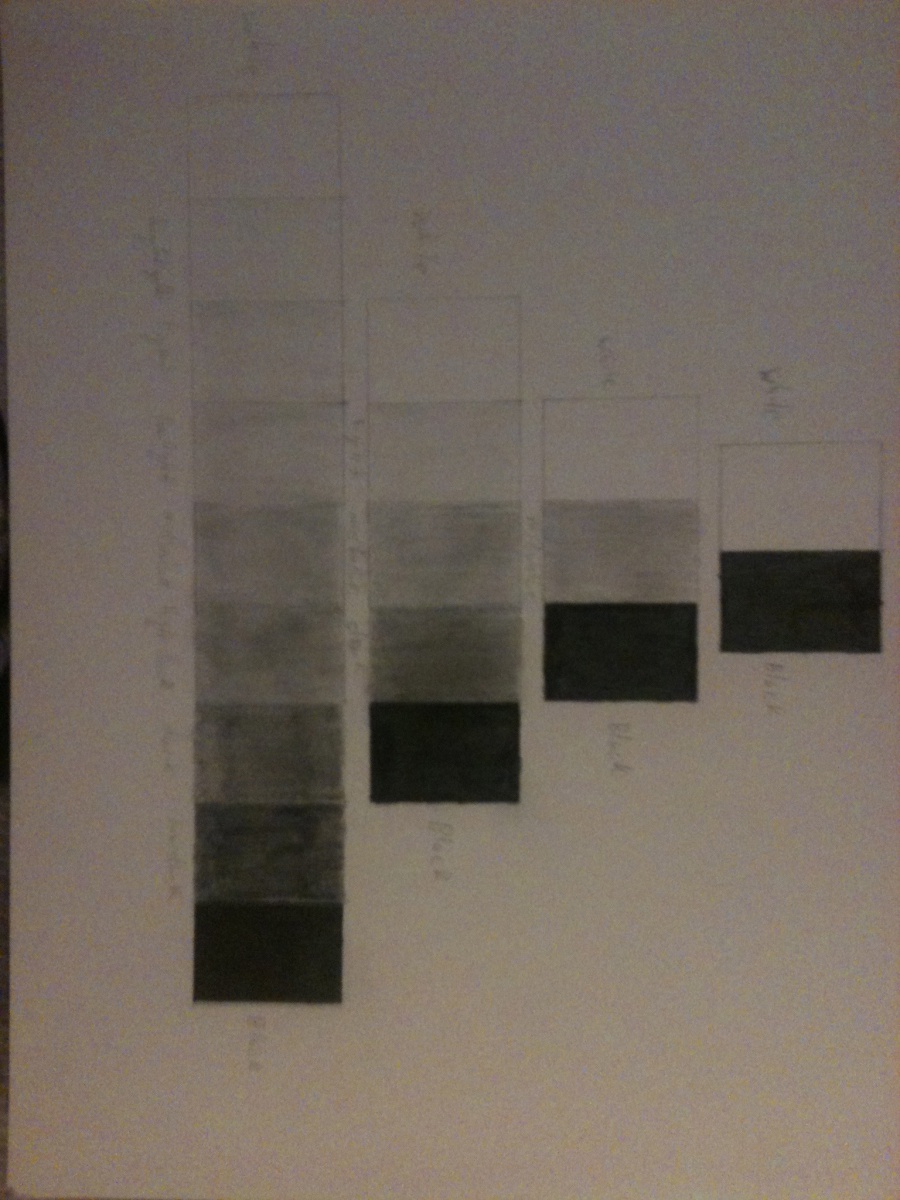
 Unfortunately, I was unable to obtain the brushes and paint to use for this research, so I chose to use several pencils instead. Creating the black and white boxes were the easiest. In order to find the midvalue, and all of the values surrounding it, I started from the black in the last row. I made each subsequent box lighter as I went down the chart, until I got to the midvalue. I was happy with the midvalue I was able to achieve, and used that as a basis for the rest of the boxes in that row. For the row with five boxes, I used every “other” value (dark, midvalue, and light) to balance it. Finally, for the row with three boxes, I just added the midvalue.
Value-Scale Research
Leave a reply

