
Here is a scatterplot from a March 7 blog post titled “What Worked in 1918-1919?“:
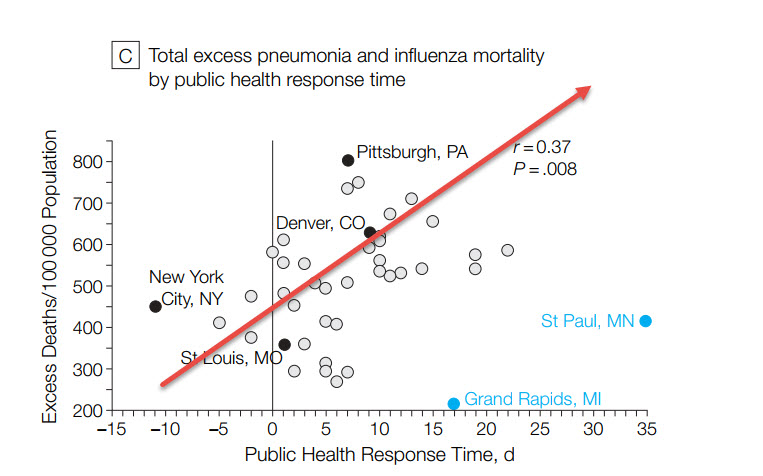
Here is the intro to this graph from the Marginal Revolution blog post:
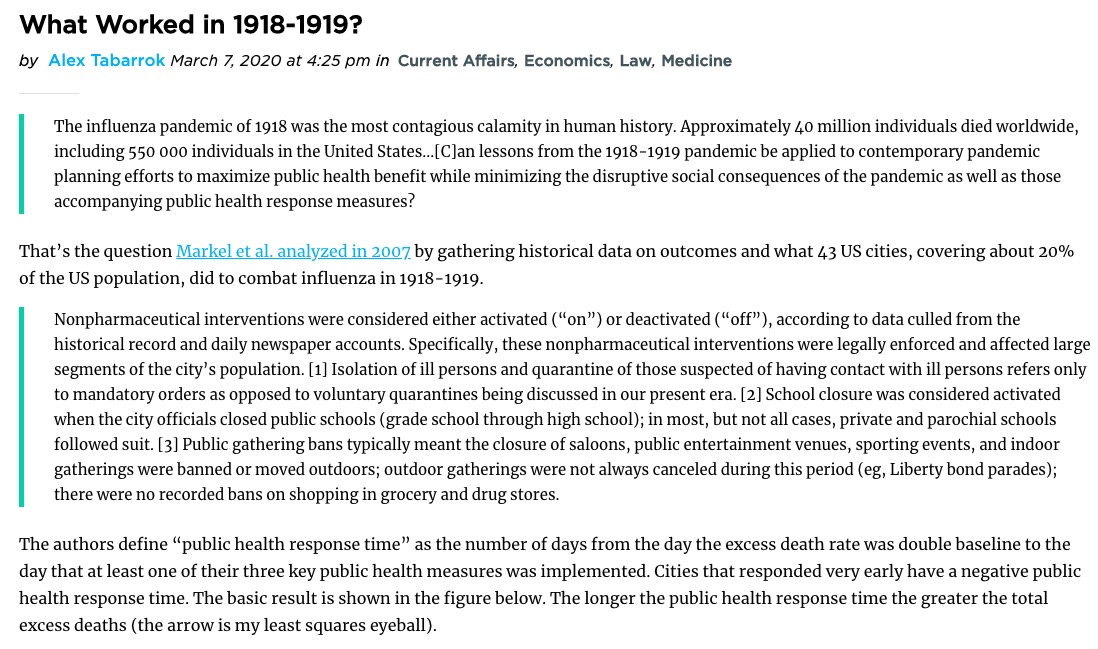
Take a look at the 2007 paper (“Nonpharmaceutical Interventions Implemented by US Cities During the 1918-1919 Influenza Pandemic“) which contains a number of additional scatterplots!

