Today is November 1st! Where did October go? Time is flying by!
It was an interesting day. Our usual zoom meeting began at 9 am but we were one intern short. Our meeting ran for a full 30 mins! Only the second time that has happened. Isana informed us of the process she goes through to create the BC Fact Sheet. In the past they gathered their stats from the census and www.bloomberg.com.
As you probably guessed today’s assignment is more updating to the BC Fact Sheet. When reviewing what needed to be done I noticed on the first page there were two pie charts that had two different sized colored circles. I mentioned this to Isana but she told me not to touch it. As the zoom continued we were instructed to refer back to the excel sheet we had previously referenced and pay attention to all the yellow highlighted sections.
- Each place the document says Full Time keep it consistent and include “
Full–Time” with the dash and capitalized T. - How are our graduates doing – update number and source
- Fundraising / Capital Expenditure – update number
- Median Age – update number
- Be sure all Totals are bolded and in the maroon color
- Superscript ALL Fall 2021 data and create a key that says data is
After the meeting one of the interns and myself began texting, discussing the instructions and how we could divide the updates. This intern and I were wondering if the other two were also feeling confusion. I went ahead and created a group chat for us that did not include Isana. Turns out collectively the four of us misunderstood the instructions for the Fall 2021 Preliminary data. I then created a zoom meeting and sent the link to them via email for us to communicate better. Our zoom was about 20 mins. We decided one intern would start with the document, create the changes assigned to her, upload to google docs, text the group chat when completed and the next person would download the .idml and the process would repeat until we finished.
I used * asterisks in the legend/ key and next to the headers. I did this because it was what I referenced when told to superscript. In the moment when I originally made the change it completely did not occur to me to change the aesthetics symbol due to it already being used to call out other information.
By 1pm Isana expected two versions and by the end of the day she wanted us to calculate our current hours. Last week we created two versions with different images. The changes today would be made to both of those documents.
Thankfully for the post part we updated everything correctly but there were a couple last minute changes. I volunteered because Isana only needed one of us to finalize the document. At 4pm I met with Isana individually on zoom.
As we went over what needed to be changed she noticed the circles in the legend on page one for the Student Body Ethnic / Racial Diversity pie charts were slightly lower than the copy it was next to. I explained to her what I had noticed and tried to mention that earlier in the day. I had not previously changed it because when I asked she misunderstood what I said and told me to leave it. Turns out I was correct. The circles on the right were larger than the ones attached to the left side of the legend/key. I corrected that and made these additional changes to the BC Fact Sheet:
- TWO superscripts – dagger and double dagger
- Remove the * asterisks note on “How are our Graduates doing”
- Place the bar graph and pie charts legend/ key in alpha order – Maroon, gold and then warm grey
- Replace the img in one of the verison to the correct faculty img
- Remove the cents on Fundraising Capital Expenditures (tenth / hundredths place)
- Match the font size of the numbers under Fundraising and Capital Expenditures (p10/13)
To view finalized BC FACT Sheet 2021 – 22: https://www.brooklyn.cuny.edu/web/about/administration/provost/institutional-effectiveness/brooklyn-college.php
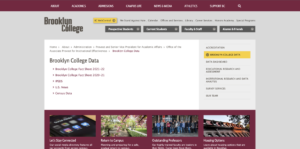
As the end of the week approaches rapidly Thursday November 4th we only had a 10 min 9 am meeting. Isana got called away directly after giving us our instructions. We were to spend a few hours exploring the BC Institute of Effectiveness website and take notes on what is and isn’t working from a UX/UI perspective. Isana reviewed the mother page and mentioned the five sections to explore and pay attention to:
- Accreditation
- Brooklyn College Data
- Educational Research and Assessment
- Survey Services
- Our Team
We were not to touch the Data Dashboard and Institutional Research and Data Analysis because Isana’s department does not have control of the information on those pages.
Overall we had to take notes on what worked, what we found messy or unclear along with what would make the site easier to navigate.
At the end of today I have completed 92 hours of internship.


