Explore Online Education Trends in 4 Bar Graphs (Assignment 2)

http://www.usnews.com/education/online-education/articles/2016-08-22/explore-online-education-trends-in-4-bar-graphs

Enrollment in online graduate programs continue to grow in popularity. About 5.8 million students enrolled in at least one online program in fall 14′ according to Babson Survey Research Group, an organization that explores trends in education. Combined with survey data from Aslanian Market Research, and Learning House, which partners with higher education institutions to develop online degree programs, highlight various trends in online learning, including growing interest in tech-focused graduate programs and fewer students who take no online courses. Based on 4 bar graphs we’ll discover the criteria of enrollment in online graduate programs per discipline (2014 v 2016), student enrollment by type of course (2012 v 2104), undergraduate online course enrollment by type of institution (Fall 2014), and role of MOOCS at surveyed institutions (2012-2015). One example of how these bar graphs are being is utilized can be determined by observing the data in let’s say the “enrollment in online graduate programs per discipline (2014 v 2016)” bar graph. Notice that the Business program remains popular from years 2014 to 2016 and an interest in computers and IT grew drastically while teaching and education lost interest. We can infer that the interest in programs are based on the job markets high demand in these skills.
Graph On News

http://finance.yahoo.com/quote/EA?p=EA

In this Link, it shows the stocks of EA, a big entertainment industry during this past 2 months have dropped substantially even with 2 big release titles called “Battlefield 1 and Titanfall 2”

Reason for this change is because the The industry want to make a change/leap forward to how they sell and distribute their products. The Demand for hard copy entertainment is declining rapidly each year and the dependence for them too.

https://www.thestreet.com/story/13547463/1/here-rsquo-s-a-reason-why-electronic-arts-ea-stock-is-falling-today.html

To keep to with this day and age, entertainment is sold in digital forms. and with that prices for these digital forms are sold cheaper then hard copies. From my observation for example in stores, a hard cover copy is a 60 dollars and will always remain that way until they are sold out. When sold in digital form, it is around 40-50 dollars tops after a month of release.

Although the stocks have dropped by a average of 4%, that is a great loss in the industry. But the overall stocks are still intact, that shows how many stores and consumers have already adapted the idea of digital form. In my opinion, the digital form is more convenient and best way to collect, if you are a type to person to collect. In digital form your purchase will always be saved in our cloud account, which means it will always remain there forever and you don’t have to worry of losing it or damaging it. Not to mention quick access and easy to navigate your OS while your already in front of your system.

Global Warming

You can’t deny global warming after seeing this graph, by Ezra Klein

https://www.washingtonpost.com/news/wonk/wp/2013/07/09/you-cant-deny-global-warming-after-seeing-this-graph/?utm_term=.60a6ce6a0a2f

Global warming is an undeniable, geological phenomenon; evidence of its presence has only increased in severity and length over time. As a result, the World Meteorological Association released a graph and a detailed study on the average temperature variance of our planet over the past 13 decades. The data clearly shows an increasing, positive trend in the global temperature, especially since 1981. In fact, nine of the ten warmest years ever recorded have occurred since 1998. The planet is not only getting warmer throughout the decades, but the rate at which this is happening appears to be growing exponentially. If this trend continues, it will cause irreparable damage to various ecosystems throughout the world, including our own. Hopefully more nations will consider this ongoing epidemic and take measures to lessen its effect.

Assignment 2

pic

http://www.nytimes.com/2016/12/02/upshot/the-new-jobs-numbers-signal-the-end-of-an-economic-era.html?rref=collection%2Ftimestopic%2FBureau%20of%20Labor%20Statistics&action=click&contentCollection=timestopics&region=stream&module=stream_unit&version=latest&contentPlacement=1&pgtype=collection

In the article “The New Jobs Numbers Signal the End of an Economic Era” discusses how unemployment rate recently fell from 4.9 percent to 4.6 percent within the month of November, which has not been this low since August 2007. The increase of unemployment that first started in August 2007 was due to losses on U.S mortgage-related bonds. Part of the unemployment decline was caused by 226,000 people who dropped out of the labor force and 160,000 people reported themselves as employed. Another reason is now middle age people especially men are not working and are not looking for work which remains a weak spot in the U.S economy. People who say they wanted a job and looked for one last month dropped to 7.4 million which is the lowest since November 2007. Bond markets are priced to reflect a return to normal interest rates. Also, there was some progress toward higher wages, where there was a 2.5 percent gain in that the wage represented income gains during the time of low inflation. With 178,000 jobs in the U.S being added in November, the combination of low unemployment rate and shrinking labor force implies that the economy will not be able to keep it for that long. In order to continue job growth, employers need to get people who are fit and ready to work. The graph used in the article was to show the rate of unemployment and how it has changed throughout the years. It also shows the average percent of unemployed people in 2016. Data collected was probably from those who are unemployed each year.

Questioning Authority

It seems that in this time that we are living in now, there seems to be no authoritative figure when it comes to information and whether or not it is valid information. Mezaros discusses a case between students and faculty, where s(he)? discusses how little students have respect for information received by people of authority in schools or universities. Maybe when you were a student in whatever institution of learning, you’d often see that one smart (sometimes arrogant) student in your class who’d often raise his hand to correct a teacher because he or she taught the information they presented was not entirely wrong, but there was a big mistake. At the end, the student would probably get schooled. Another example is that you’d also quite often see on social media platforms where the expressing of an opinion can be a “wrong opinion.” There is a video and in the comments section, there are about 10 users arguing over some silly idea. One user usually trys to start an argument and cause a reaction. At this point in time, it is usually those 10 trying to lay down some facts to prove their opinion and others saying that the other’s facts are wrong and baseless, etc. So we can see there really is a question on authority in terms of information. It seems that all facts are usually false without providing more facts, and those facts are false without even more facts, and the cycle goes on (to some point where everyone can agree, but that’s usually, if ever, hardly the case because everyone wants to be right).


Assignement #2

201

Soccer has been the number one sport worldwide for a century. It is known ,for the quality, respect and fitness of the game.  In 2016, there was some complaints from the fan during the Euro Cup, one of the greatest Tournament in the planet for the tickets price.However, the authority only provided a temporary solution till the tournament was over. Based on the facts it is really disappointing that soccer the most popular sport of the world is not supporting the fan. Clearly, they don’t understand without fan there wouldn’t be sponsor to keep them going. The statistics diagram above show the tickets price during in interval of a decade it is like is never going to be enough.

Assignment #2

The newspaper articles talks about the increase in the suicide rate of children between the ages of 10 and 14 and how it has caught up with the amount of deaths caused by traffic accidents.  There are many factors for the cause suicide and these factors are amplified through social media like Facebook and Instagram.  Also, deaths due to traffic accidents for children ages 10 to 14 have decreased a trend that is true across the entire population.  It also goes on to say how there has been a sharp increase in the suicide rate for girls due to them dominating the world of social media and also because they, on average, start to go through puberty at an earlier age leading to problems that they might not be adequately equipped to deal with.

untitled2

The graph shows how rare death is for adolescents are. It also shows how, from 2007 to 2014, the death rate due to traffic accidents has decreased by half while the death rate due to suicide has doubled and has passed up the death rate dude to traffic accidents.

http://www.nytimes.com/2016/11/04/health/suicide-adolescents-traffic-deaths.html?rref=collection%2Fsectioncollection%2Fhealth&action=click&contentCollection=health&region=rank&module=package&version=highlights&contentPlacement=8&pgtype=sectionfront&_r=0

Graph on Shark Attacks, Joel Chapman

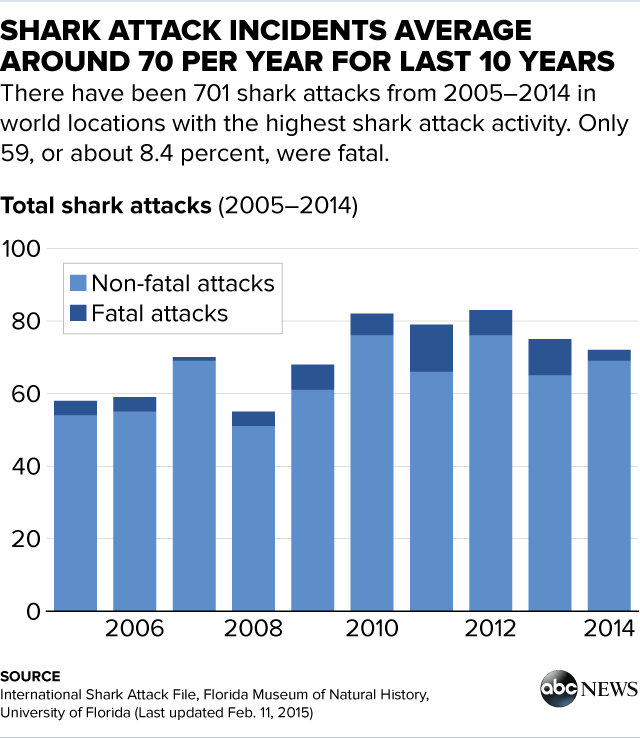
After a shark attack incident, Florida Museum of Natural History at the University of Florida decided to create some data sheets on the amount of shark attacks that has happened between 2005 and 2014. The graph above is just one of few graphs. It was hard for researchers to exactly tell the accurate amount of attacks, but they were able to tell that the majority of attacks were dealt by Great White sharks, followed by tiger sharks, and then bull sharks. Based on the graph, one can see that since 2005, the amount of attacks had increased, reached a plateau by 2012, and then has started to decrease. One can say that a factor of the increased shark attacks was due to the popularity of surfing increasing over some period of time, as it is known that sharks tend to spontaneously jump an attack preys. Based on the graph, you can assume that after the high amount of attacks in 2007, people had decided to stay out of the water the following year, and in the end did not notice many incidents. After, they decided to enter back, thus increasing the number of victims. These are nothing but speculations, but if one knows about Florida and shark attacks, some things will correlate.

Assignment #2

Brooklyn and Queens have never been this expensive by Emily Nonko

(http://ny.curbed.com/2016/10/13/13257034/brooklyn-queens-sales-market-manhattan-rentals)

This article focuses on home sales in Brooklyn, Queens and Manhattan.  Home sale prices have reached a high record for the third quarter of this year.  There are many factors that contribute to this increase in sale prices that in turn create a decrease in inventory available for sale.  Prices are escalating without negotiations between sellers and buyers.  Investors conveniently are launching several apartment listings that end up spending more time on the market due to being placed in a high price bracket.  As a result, buyers are being presented with a large supply of options, however all of this supply is priced at the higher end.  One graph in the article is used to support the information presented on the borough of Brooklyn:

fullsizerender

The graph displayed is from the Brooklyn Concoran’s Group Resale condos data and it is used in the article to show the comparison of this year’s third quarter (3Q16) with last year’s third quarter (3Q15) in condos resale in Brooklyn.  The graph uses data of several condo listings that the Brooklyn buyers have at their disposal on the housing market.  It demonstrates that with only 4% increase in developments (inventory), the market for resale condo is still yielding strong sales with a 9% increase in price value.   The condo resale prices are not only above median price but also above average price between these two quarters.  This graph demonstrates that the record increase in Brooklyn home sale price is still going up.  A prosperous outcome for investors selling property in Brooklyn.

For more information, the remaining two graphs are from the Concorran’s report (link found at the bottom of the article under sources) that illustrate resale condos prices at a steady increase from 3Q8 until 3Q16 and a more graphic representation of the increase in median and average price value over the last two quarters 3Q15 and 3Q16.

fullsizerender2fullsizerender1

Assignment #1

jr

My name is Jenny (R.T.) and I am majoring in mathematics to work as a financial analyst.  Probability and statistics besides being an enjoyable and fundamental course for my degree, relates to my future career.  As a financial analyst, I would be focused on the relationships of time value of money and interest.  Measuring the risks involved with statistics, I would be recommending the best choice among several alternatives to my clients with the goal to reduce risk and monetary losses.  Financial analysis uses probability and statistics by evaluating alternatives allowing for the determination of the probability of success or failure of a project or investment opportunity.  Investors (private, government, public organizations, among many others) seek the assistance of financial analyst because of their thorough examination of all possibilities that will not only generate more income but also service producing outcomes.  By being presented with this evaluation, they can assume the risk involved or opt for ways to prevent or reduce these risks.  Probability and statistics is highly beneficial to this degree for the reasons stated.