Tag Archives: cultural awareness

Non-Mendelian Genetics

Non-Mendelian Genetics

Co-Dominance and multiple alleles

Co-dominance is said to occur when there is an expression of two dominant alleles. The prototypical case for this is the human ABO blood grouping.
ABO blood type
Three alleles exist in the ABO system: A, B and O. This results in four blood types: A, B, O and the blended AB.
ABO system codominance

Incomplete Dominance

During Mendel’s time, people believed in a concept of blending inheritance whereby offspring demonstrated intermediate phenotypes between those of the parental generation. This was refuted by Mendel’s pea experiments that illustrated a Law of Dominance. Despite this, non-Mendelian inheritance can be observed in sex-linkage and co-dominance where the expected ratios of phenotypes are not observed clearly. Incomplete dominance superficially resembles the idea of blending inheritance, but can still be explained using Mendel’s laws with modification. In this case, alleles do not exert full dominance and the offspring resemble a mixture of the two phenotypes.

Incomplete Dominance
Incomplete dominance in snapdragon flowers superficially appears like blending inheritance.Credit: Jeremy Seto (CC-BY-NC-SA)
The most obvious case of a two allele system that exhibits incomplete dominance is in the snapdragon flower. The alleles that give rise to flower coloration (Red or White) both express and the heterozygous genotype yields pink flowers. There are different ways to denote this. In this case,  the superscripts of R or W refer to the red or white alleles, respectively. Since no clear dominance is in effect, using a shared letter to denote the common trait with the superscripts  (or subscripts) permit for a clearer denotation of the ultimate genotype to phenotype translations.

Problem: Incomplete Dominance

If pink flowers arose from blending inheritance, then subsequent crosses of pink flowers with either parental strain would continue to dilute the phenotype. Using a Punnet Square, perform a test cross between a heterozygous plant and a parental to predict the phenotypes of the offspring.

Epistasis and Modifier Genes

biochemical pathways
Interplay of multiple enzymes in a biochemical pathway will alter the phenotype. Some genes will modify the actions of another gene. Credit: Jeremy Seto (CC0)

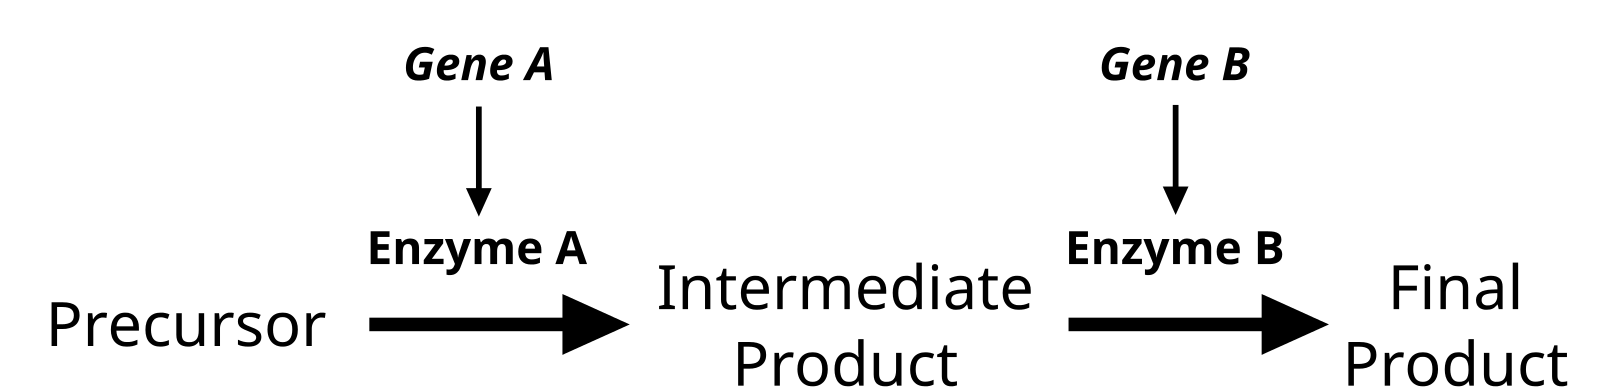
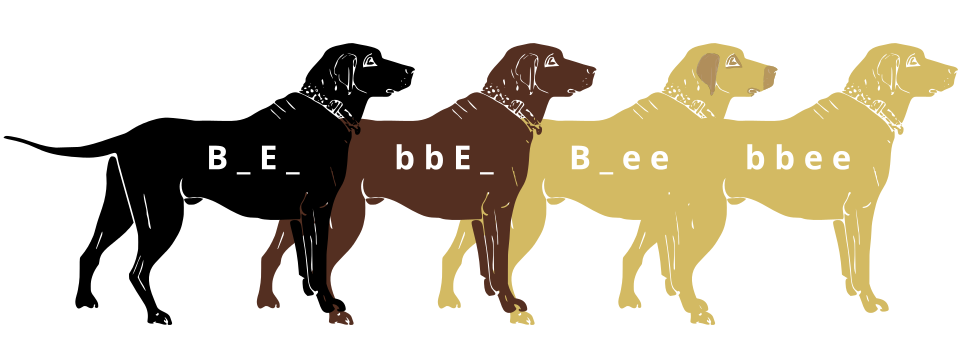
Genes do not exist in isolation and the gene products often interact in some way. Epistasis refers to the event where a gene at one locus is dependent on the expression of a gene at another genomic locus. Stated another way, one genetic locus acts as a modifier to another. This can be visualized easily in the case of labrador retriever coloration where three primary coat coloration schemes exist: black lab, chocolate lab and yellow lab.

3labradorcols
Chocolate lab (top), Black lab (middle), Yellow lab (bottom) coat colorations arise from the interaction of 2 gene loci, each with 2 alleles. Credit: Erikeltic [ CC-BY-SA 3.0]

Two genes are involved in the coloration of labradors. The first is a gene for a protein called TYRP1, which is localized to the melanosomes (pigment storing organelles). Three mutant alleles of this gene have been identified that reduce the function of the protein and yield lighter coloration. These three alleles can be noted as “b” while the functioning allele is called “B“. A heterozygous (Bb) or a homozygous dominant individual will be black coated while a homozygous recessive (bb) individual will be brown.

Labrador Retrievers blackandchocolate
Black lab (BB or Bb) and Chocolate lab (bb) Credit: dmealiffe[CC BY-SA 2.0]

The second gene is tied to the gene for Melanocortin 1 Receptor (MC1R) and influences if the eumelanin pigment is expressed in the fur. This gene has the alleles denoted “E” or “e“. A yellow labrador will have a genotype of either Bbee or bbee.

Labrador Retrievers black and yellow
Black lab (EE or Ee) and Yellow lab (ee) [CC0]
The interplay between these genes can be described by the following diagram:

Labrador Retrievers black and yellow
Black lab (B_E_, Chocolate lab (bbE_), Yellow lab with dark skin where exposed (B _ee) and Yellow lab with light skin where exposed. Credit: Jeremy Seto (CC-BY-SA 3.0)

Tags: ,

Sex-linked Genes

Sex Chromosomes

XXXY

For the most part, mammals have gender determined by the presence of the Y chromosome. This chromosome is gene poor and a specific area called sex determining region on Y (SRY) is responsible for the initiation of the male sex determination. The X-chromosome is rich in genes while the Y-chromosome is a gene desert. The presence of an X-chromosome is absolutely necessary to produce a viable life form and the default gender of mammals is traditionally female.

Human X and Y chromosomes with G-Banding.

Chromosomal painting techniques can reveal the gender origin of mammalian cells. By using fluorescent marker sequences that can hybridize specifically to X or Y chromosomes through Fluorescence In Situ Hybridization (FISH), gender can be identified in cells.

X Y chromosome
The male cells have an X and a Y while the female cells have X and X combination. Credit: Janice Y Ahn, Jeannie T Lee [CC BY 2.0]

Tags: , , ,

Maternal Lineage (activity)

The PCR amplification of the mitochondrial control region

There are 2 hypervariable regions within the control region of the mitochondria. This exercise amplifies just one of these. For more definitive results, both should be amplified and sequenced. This exercise will permit us to have a rough idea of the origins of our maternal line and we will be able to attribute ourselves to various tribes throughout the world. The human mitochondrial genome (genbank file).

Forward Primer 5’-TTAACTCCACCATTAGCACC-3’

Reverse Primer 5’-GAGGATGGTGGTCAAGGGAC-3’

  1. PCR the previously extract DNA  samples
    • Pour 2% agarose into casting apparatus in refrigerator
    • 2 gels per class need to be made → 100ml of TBE with 2g agarose
    • add 5μl SYBR safe solution into the molten agarose before casting
    • place 2 sets of combs into the gel → at one end and in the middle
  1. load gel with DNA ladder and PCR
  2. Run gel at 120V for 20 minutes
  3. Visualize on UV transilluminator
  4. Document with camera to verify amplification
  5. The instructor will submit the viable reactions for sequencing
  6. Analyze data during Bioinformatics Lab session
    1. Using NYCCT email address, register for account at https://dnasubway.cyverse.org/
    2. retrieve reference mitochondrial sequences
    3. perform multiple sequence alignment using MUSCLE
    4. draw phylogenetic trees using PHYLIP and visualize using FigTree

Tags: , , ,

Maternal Lineage

Mitochondrial and Maternal Inheritance

In addition to the 23 chromosomes inherited from mother and 23 chromosomes inherited from father, humans have an additional genome that is only inherited from the mother. This genome comes from the endosymbiotic organelle, the mitochondrion.

Mitochondrial dna lg

Mitochondria are thought to have arisen in the eukaryotic line when bacteria capable of detoxifying the deadly effects of atmospheric oxygen were engulfed by a eukaryote that did not proceed to consume it. Over the course of time, these formerly free-living bacteria became dependent on the eukaryotic cell environment while providing the benefit to the host cell of aerobic respiration. Hallmarks of this endosymbiotic event include: the inner prokaryotic membrane surrounded by the outer eukaryotic membrane, the presence of prokaryotic ribosomes and most significantly, the circular prokaryotic chromosome. Mitochondria still replicate independently of the host cell but can not survive outside of this cellular environment. Animal mitochondria have the simplest genomes of all mitochondrial genomes, ranging from 11-28kb. The human mitochondrial genome consists of 37 genes which are almost all devoted to processing ATP through oxidative phosphorylation.

Human mitochondrial genome

The human mitochondrial genome (genbank file) consists of 16,569 nucleotides (16.6kb). While most of this 16.6kb genome consists of protein encoding genes, approximately 1.2kb non-coding DNA takes part in signals that control the expression of these genes and replication processes. It is the area of DNA where the double-strandedness is displaced and having the name D-loop (displacement loop). Mutations in this area generally have very little effect on the functioning of the mitochondria. Because of this reduced selection pressure on this area, this control region is also referred to as the hypervariable region. This hypervariable region actually has 10 times more SNPs than the nuclear genome. Due to this abundance of mutations, it is possible to track down the maternal line of an individual. Why just maternal? The human oocyte contains many mitochondria while sperm cells only contain mitochondria that power the flagellar motion. Upon fertilization, the flagellum and the associated mitochondria are lost, leaving the zygote with only maternal mitochondria.

The cluster of SNPs found in the mitochondrial control region are linked and are always inherited together. Because of the lack of paternal contribution, this linkage is referred to as a haplotype, or “half-type”. Tracking these polymorphic haplotypes, a family tree of humans was developed in the 1980s which concluded that humans arose from a metaphorical “Mitochondrial Eve” 200,000 years ago. As a metaphor to the Biblical Eve, this alludes to an origin but unlike the Biblical event, this does not mean that it was a single woman that gave rise to all of modern humanity. On the contrary, the metaphor merely indicates that a series of females; sisters and cousins, of this line gave rise to modern humans.

 Mitochondrial Migration Map
Migration map of mitochondrial haplogroups. Numbers represent 1000 years ago. https://commons.wikimedia.org/wiki/File:Map-of-human-migrations.jpg (CC-BY-SA 3.0)

The use of mitochondria for this analysis provides great flexibility, especially from ancient sources. Unlike the nuclear genome which only has 2 copies of DNA per cell, the mitochondria are abundant in number and provide many copies of genome per cell. Ancient sources of DNA in fossils will most often have degradation of the DNA. The mitochondrial genome is just as likely to undergo degradation over time, however the high copy number allows for gaps to be filled in easily. SNPs do not alter the overall size of the hypervariable region, therefore amplification by PCR can not resolve these differences based on agarose gel migration. However, amplicons (amplified copies) can be sent for sequencing whereby each nucleotide can be called out in succession and reveal the specific SNPs.


Tags: , , ,

Alu Insertion (activity)

Alu’s are unique SINEs that appear in the primate lineage and reveal the lineage and diversification of primates. While retrotransposons can disrupt gene (as in some cases of hemophilia), they often land outside of genes or within introns without effect. One example of a non-disruptive Alu element in humans is found in the location called PV92 on chromosome 16. This element is of the youngest subfamily of Alu, called Ya5.

Since PV92 does not cause any deleterious effects, it can be used as a non-selected marker to illustrate lineage. Some people have an Alu element int his location while others do not. The presence or absence of this marker is viewed as an allele. This lab uses primer that flank the location of the Alu insertion that span 416 bp. If an Alu is present, the amplified DNA will be 300bp larger (the size of an Alu) at 731bp.

Exercise: In silico PCR of PV92

Forward primer: 5′ GGATCTCAGGGTGGGTGGCAATGCT 3′
Reverse primer: 5′ GAAAGGCAAGCTACCAGAAGCCCCAA 3′

    1. Perform Virtual PCR Informatics Exercise/Discussion
    2. Find the PCR fragments in Ugene
      1. Download the sample FASTA file: PV92 sample
      2. Open the file in Ugene and select option “As Separate Sequences in Viewer”
      3. Select the “In Silico PCR” button on the far right (double helix button) and insert the primers
        • primerbutton
      4. A PCR product should be noted for one of the sequences after pressing “Find Products anyway”
      5. Click on the second sequence in the viewer and Press “Find Products anyway”
      6. What are the sizes of each product, if any?
      7. What does this inform us?

Exercise: PCR genotype PV92 locus

    1. PCR the individual samples
    2. Pour 2% agarose into casting apparatus in refrigerator
      • 2 gels per class need to be made → 100ml of TBE with 2g agarose
      • add 5μl SYBR safe solution into the molten agarose before casting
      • place 2 sets of combs into the gel → at one end and in the middle
    1. Load DNA ladder and PCR samples
    2. Run gel at 120V for 30 minutes
    3. Visualize on UV transilluminator
    4. Score gels for the presence/absence of the alleles to determine genotype frequency in the class

Tags: , , ,

Tracing Origins

Being Human

Lions painting, Chauvet Cave (museum replica)
Drawings dating to approximately 30,000 years ago in the Chauvet Cave
What constitutes being human? Many will point at a cultural identity and leaving long-standing remnants of that culture. Such prehistorical artifacts like cave drawings and tools provide an anthropological framework for identifying what it is to be human, but the biological identity remains locked in the history of our DNA.

Clovis Rummells Maske
Spear points of the Clovis Culture in the Americas dating to approximately 13,000 years ago. Credit:Bill Whittaker [CC-BY-SA 3.0]

The Great Apes

ape_tree
Phylogenetic tree generated with Cytochrome Oxidase I (COI) genes.

Homo sapiens represent a branch of primates in the line of Great Apes. The family of Great Apes consists of four extant genera: Homo, Pan, Gorilla, Pongo. Karyotype analysis (Yunis et al., 1982) reveals a shared genomic structure between the Great Apes. While humans have 46 chromosomes, the other Great Apes have 48. Molecular evidence at the DNA level indicates that Human Chromosome 2 is a fusion of 2 individual chromosomes. In the other Great Apes, these 2 Chromosomes are referred to as 2p and 2q to illustrate their synteny to the human counterpart.

Synteny map of Human, Chimpanzee, Gorilla, Orangutan and Marmoset (non-ape primate). Mapping of chromosome 2a and 2b in the apes compared to 6 and 14 in the marmoset illustrates the relatedness of the chromosomal structure of the apes. Minor inversions are apparent in the orangutan chromosome. Credit: Jeremy Seto [CC-BY-NC-SA]
Chimpanzees (Pan) are the closest living relatives to modern humans. It is commonly cited that less than 2% differences in their nucleotide sequences exist with humans (Chimpanzee Sequencing and Analysis Consortium, 2005). More recent findings in comparing the complement of genes (including duplication and gene loss events) now describes the difference in genomes at about 6% (Demuth JP, et al., 2006).

Lines
The Pan-Homo divergence. A display at the Cradle of Humankind illuminates the skulls of two extant Hominini with a series of model fossils from the Hominina subtribe of Austrolopithecina and Homo. Credit: Jeremy Seto [CC-BY-NC-SA] https://flic.kr/p/SmhHTd

The Genus Homo

The strong fountain
An underground lake at inside the Sterkfontein Cave system at the Cradle of Humankind (South Africa) Credit: Jeremy Seto [CC-BY-NC-SA] https://flic.kr/p/RczrEg
The rise of the human lineage is thought to arise in Africa. Fossils of Austroloptihs (southern apes) found in death traps, like those at the Cradle of Humankind, reveal a historical record of organisms inhabiting the landscape. The breaks in the ceiling of the caves  provide opportunities for animals to fall inside these caves to their death. The limestone deposits of the caves serve as an environment for fossilization and mineralization of their remains. An abundance of fossilized hominids in these caves including Australopithecus africanus, Australopithecus prometheus, Paranthropus boisei, and the newly discovered Homo naledi continue to reveal the natural history of the genus Homo from 2.6 million to 200,000 years ago.

The entrance to the Sterkfontein Caves
The entrance to the archaeological site at Sterkfontein, Cradle of Humankind (South Africa). Credit: Jeremy Seto [CC-BY-NC-SA] https://flic.kr/p/ULs2Sv

Ancient DNA of Humans

Spread and evolution of Denisovans

In 2008, a  piece of a finger bone and a molar from a Siberian Cave were found that differed  slightly from that of modern humans and Neandertals. The cave, called Denisova Cave, maintains an average temperature of 0ºC year round and the bones were suspected to contain viable soft tissue. An initial mitochondrial DNA analysis revealed that these hominids represented a distinct line of humans that overlapped with them in time (Krause et al., 2010). Analysis of the full nuclear genome followed and indicated that interbreeding existed between these Denisovans, Neandertals and modern humans (Reich et al., 2010). Furthermore, analysis of DNA from a 400,000 year old femur in Spain revealed that these three lines diverged from the species Homo heidelbergensis with Denisovans closest in sequence similarity (Meyer et al., 2016).

Between modern humans, markers found in the mtDNA can be used to trace the migrations and origins along the maternal line. Similarly, VNTRs found on the Y chromosome have revealed migration patterns along paternal lines within men. Other markers, like the insertion points of transposable elements can be used to further describe the genetics and inheritance of modern humans while providing a snapshot into evolutionary history.

Other Resources


Tags: , , , ,

Genetics

Writing the Rules of Heredity

Gregor MendelIn the mid 1800’s, an Augustinian friar named Gregor Mendel formalized quantitative observations on heredity in the the pea plant. He undertook hybridization experiments that utilized purebred or true breeding plants with specific qualities over many generations to observe the passage of these traits. Some of these physical traits included: seed shape, flower color, plant height and pod shape.


Snow pea flowers
Pea flowers
The pea plant (Pisum sativum) offered a great advantage of being able to control the fertilization process and having large quantities of offspring in a short period of time. In a simple experiment of tracking the passage of a single trait (monohybrid cross) like flower color through multiple generations he was able to formulate rules of heredity. In this case, pea plants either produced white flowers or purple flowers for many generations (true breeding purple flower or true breeding white flower). These true breeding plants are referred to as the Parental Generation (P). By removing the male parts of the pea flower (anthers containing pollen), Mendel was able to control for self-pollination. The hybridization came from applying the pollen from one true breeding plant  to the female part (the pistil) of the opposite true breeding plant.  The subsequent offspring are referred to as the First Filial Generation (F1).  In the first generation, all flowers are purple. Permitting self-pollination generates a Second Filial Generation (F2). This generation sees the re-emergence of the white flowered plants in an approximate ratio of 3 purple flowered to 1 white flowered plants.

Angiosperm life cycle diagram-en
Male and female parts of flowers. Mendel removed the anthers containing pollen to prohibit self-pollination and selectively applied the pollen to stigmas in order to control the “hybridization”.

The loss of one variant on the trait  in the F1 plants with the re-emergence in the F2 prompted Mendel to propose that each individual contained 2 hereditary particles where each offspring would inherit 1 of these particles from each parent. Furthermore, the loss of one of the variants in the  F1 was explained by one variant masking the other, as he explained as being dominant. The re-emergence of the masked variation , or recessive trait in the next generation was due to the both particles being of the masked variety. We now refer to these hereditary particles as genes and the variants of the traits as alleles.

Mendel seven characters

Mendel’s Rules of Segregation and Dominance

The observations and conclusions that Mendel made from the monohybrid cross identified that inheritance of a single trait could be described as passage of genes (particles) from parents to offspring. Each individual normally contained two particles and these particles would separate during production of gametes. During sexual reproduction, each parent would contribute one of these particles to reconstitute offspring with 2 particles. In the modern language, we refer to the genetic make-up of the two “particles” (in this case, alleles) as the genotype and the physical manifestation of the traits as the phenotype. Therefore, Mendel’s first rues of inheritance are as follows:

  1. Law of Segregation
    • During gamete formation, the alleles for each gene segregate from each other so that each gamete carries only one allele for each gene
  2. Law of Dominance
    • An organism with at least one dominant allele will have the phenotype of the dominant allele.
    • The recessive phenotype will only appear when the genotype contains 2 recessive alleles. This is referred to as homozygous recessive
    • The dominant phenotype will occur when the genotype contains either 2 dominant alleles (homozygous dominant) or on dominant and one recessive (heterozygous)

Punnett square mendel flowers
The F1 cross (Punnett square) illustrating flower color inheritance in the F2
The Punnett Square is a tool devised to make predictions about the probability of traits observed in the offspring in the F2 generation and illustrate the segregation during gamete formation.

The Single Trait Cross (Monohybrid Cross)

wrinkle
Monohybrid cross (one trait cross) observing the pod shape of peas.
green
Monohybrid cross (on trait cross) observing the pod color of peas.

Corn Coloration in an F2 Population (activity)

F2 Corn
A corn cob contains hundreds of kernels. Each kernel is a seed that represents an individual organism. In the cob, we can easily see kernel color as a phenotype.

  1. Retrieve an F2 corn cob
  2. Count a total of 100 kernels
    1. Tally the number of Yellow Kernels within that 100 (in the dried state, anything yellow or honey colored counts as yellow)
    2. Tally the number of Purple Kernels within that 100 (in the dried state, purple colored kernels may appear brown)
    3. Ignore any speckled kernels that may have yellow and purple within them
  3. Compare numbers with the class as a whole
  4. From the numbers:
    1. Is there a dominant color?
    2. Which is dominant, if there is?
    3. Create a Punnet square to illustrate the expected number of each color in a simple dominant:recessive paradigm.

      Tags: , ,