Contents [hide]
Discovering Buffers
- Take a small beaker of distilled water and determine its pH. Add one drop of strong acid or of strong base to the water and observe the pH reading on the meter.
- Now take a small sample of either the standard pH buffer or of any other buffer solution in the lab and add a drop of either strong acid or strong base. Does the reading on the pH meter remain constant or does it change rapidly as it did with the distilled water?
Set-up and calibrate Vernier Go-direct pH meter
- Connect pH probe to computer via USB
- Launch Vernier Graphical Analysis on computer
- In the lower left corner, click on “Mode:XXXX” and change mode to “Event Based”
- Choose “Event with Entry”
- Replace “Event Name” to “NaOH”
- Enter the units “ml”
- Optionally click “Average over 10 seconds” and click “Done”
- In lower right corner click on “pH:####”
- Click “Calibrate”
- Choose “Three-point Calibration” from “Perform a” menu
- Rinse probe with water
- Place probe in pH 3 solution and wait for reading to be somewhat stable
- Enter “3” as the value and press “Keep”
- Remove probe and rinse with water
- Place probe in pH 10 solution and wait for reading to be somewhat stable
- Enter “10” as the value and press “Keep”
- Remove probe and rinse with water
- Place probe in pH 7 solution and wait for reading to be somewhat stable
- Enter “7” as the value and press “Keep”
- Remove probe and rinse with water
- Click “Apply”
Titration of Acetic Acid
Use the following situation to mimic the set-up below: https://iwant2study.org/lookangejss/chemistry/WASB.html

Perform Titration of Acetic Acid with Sodium Hydroxide
- Fill Burette with 0.1 M Sodium Hydroxide (NaOH)
- Measure 50 ml of 0.1 M Acetic Acid into 250ml beaker and add 5 drops of phenopthalein
- Swirl solution and place cleaned probe into solution
- Near the upper right corner “View Options” menu (three rectangles), toggle to “Meter”
- Press “Collect”
- When reading is stable, press “Keep”
- In “Keep Point” dialog, enter “0” in the first field since 0ml NaOH has been added to the Acetic Acid
- Press “Keep Point”
- Release 3ml of NaOH from the Buret stopcock into the Acetic Acid beaker below
- Swirl the solution to mix and wait for the meter reading to stabilize
- Repeat Step 8. remembering to increase the value by 3ml NaOH cumulatively (0,3,6,9…) until the readings are greater than pH 10
- Repeat the steps an additional 3 additions
- Click on “Stop”
- On the “View Options” menu (Upper Right three boxes icon), select “Graph and Table”
- Click on “Untitled” on the Upper Left Corner
- Select “Export”
- Select “.csv”
- Click on “Export CSV”
- Navigate to a location to save the table data (as csv) and provide an appropriate filename
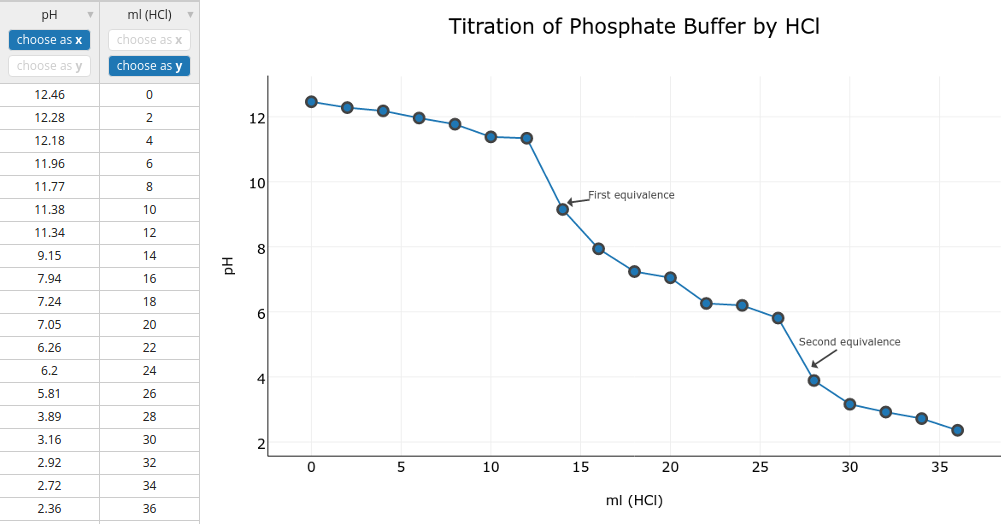
- Share your CSV file from a flash drive to your group and you can now use this data to plot your own graph in Chart Studio to share with your Instructor.
- Chart Studio Plot.ly is a free to use system where you can log-in with common single sign-on (Facebook, Gmail, GitHub. Twitter, etc)
- Students do NOT require premium features to share charts with instructors
Scatterplot Tutorial

Download the data to try in Plot.ly Follow this tutorial on using Plot.ly to generate a graph. However, do not draw a trendline.


