Project 1: Why Millennials Are Not Having Babies
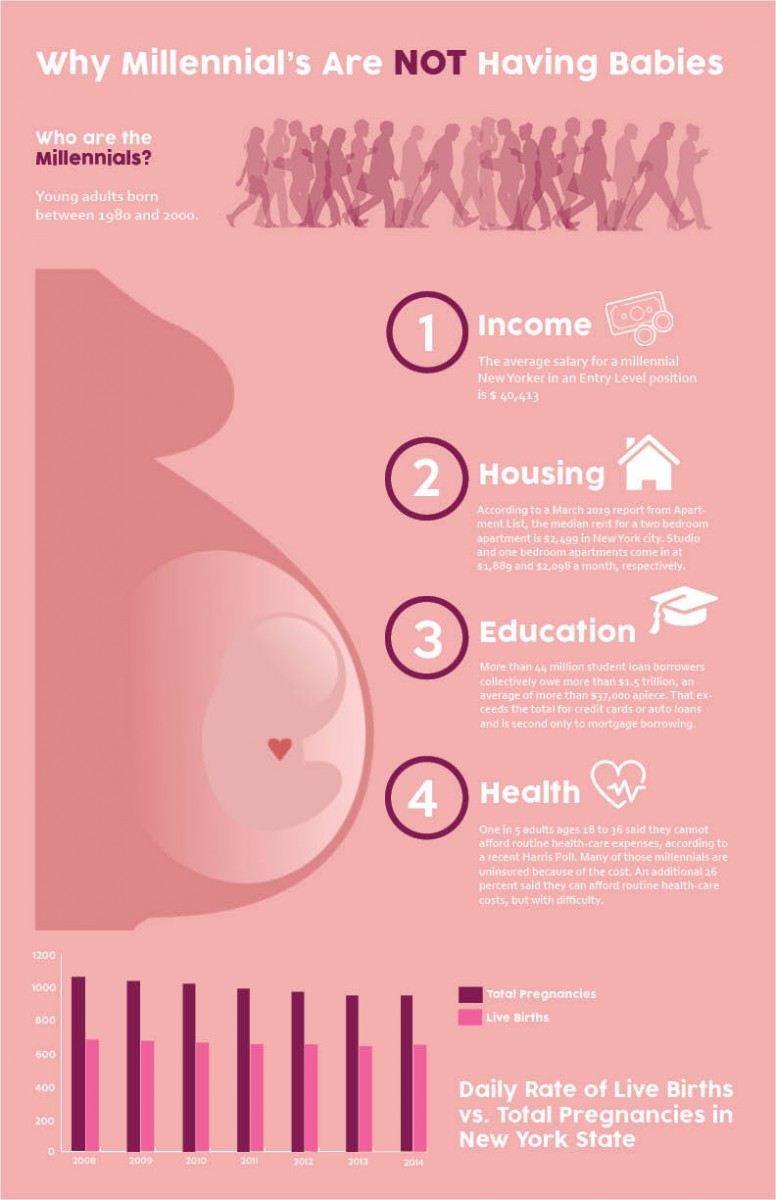
In this assignment, the objective was to create an infographic on the topic of your choice highlighting four key points and incorporating a graph. I chose to create an infographic on declining birth rates among Millennials (young adults between the age of 18-25) focusing on New York City. The key points highlighted were Income, Housing, Education, and Health. The graph illustrates the decline in confirmed pregnancies to live births among Millennials.
Project 2/3: Butterfly Diagram& Flowchart
diagram_flow chart FINAL-compressed
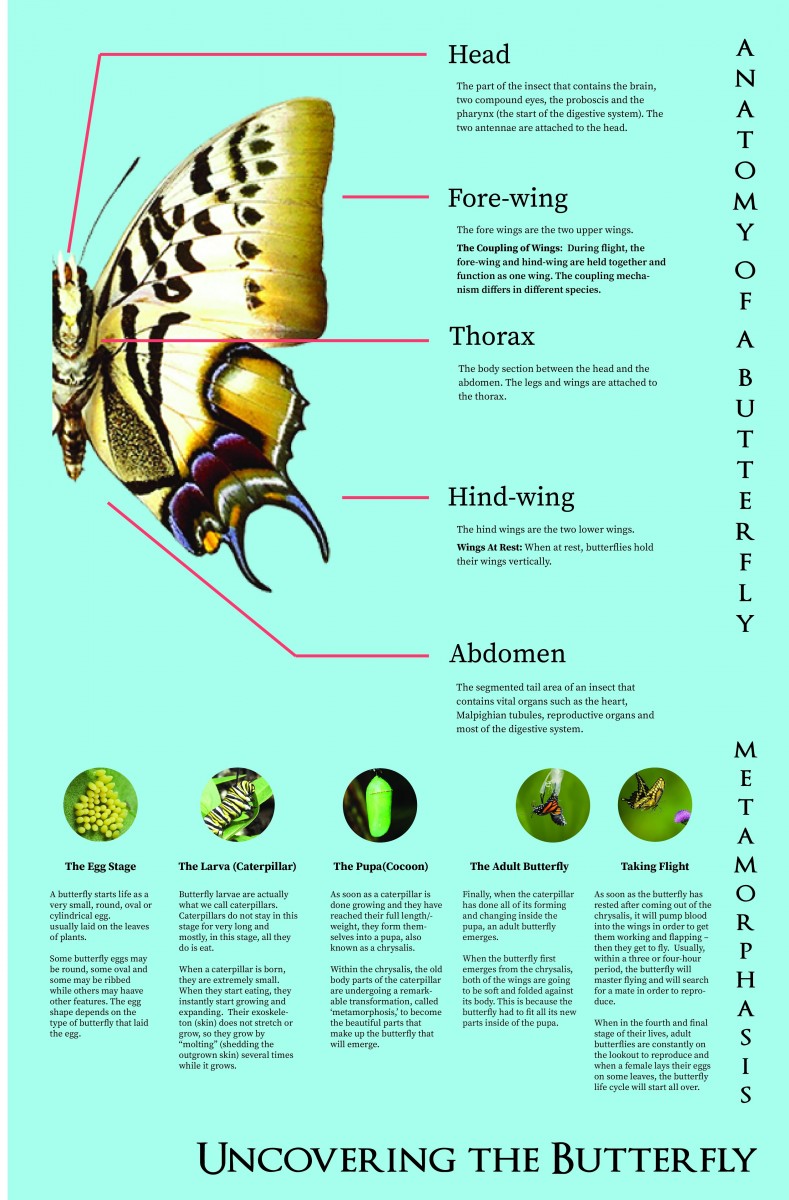
In this assignment, I combined two of my projects to construct a poster that is both a flow chart and diagram. I chose to the anatomy of a butterfly for this project because of the relationship between a caterpiller’s metamorphosis to the main components of an adult butterfly.

