9/24 Assignment

229692_10151578748358080_617562081_n

As a student of NYCCT, and currently in Probability & Statistics, The probability of me getting a pass grade is slowly diminishing due to Attendance ….maaaayyybbeeee. Since the course allows 3 absence and I already used up 1, also lateness counts has half an absence. The amount of days remaining until the end of the semester, What are my chances of actually fulfilling all 3 absences (lateness can also count) and obtaining a WU grade for this course? Variables can be public services, work, travel time, weather, and also anything you can think of that is reasonable.

Stats and probability relate to my career in becoming a professor to a high degree. Stats and probability is pretty much used in everyday life, especially when its comes to grading tests, figuring out averages of tests grades, creating percentages for a grading rubric and so much more. Unless I plan on teaching in this course, I am not sure how much more in depth I would personally have to go, but as for the basics of stats, I think its a standard that I at least must know

Stats and probability relate to my career in becoming a professor to a high degree. Stats and probability is pretty much used in everyday life, especially when its comes to grading tests, figuring out averages of tests grades, creating percentages for a grading rubric and so much more. Unless I plan on teaching in this course, I am not sure how much more in depth I would personally have to go, but as for the basics of stats, I think its a standard that I at least must know.

I haven’t really established myself in the career that I;m striving for. However, I do plan on working as an Information Security Analyst. Statistics play a crucial part in it that job as it tells me the baseline of the current securities. It also outlines the trends of the most recent vulnerabilities and produces a numerical value of the number of occurrences. With that information, it is easier to correct the current deficiencies associated and make a better security.

485227_390370314316107_340803730_n

Statistics and my career

project-1-pic

As and electrical engineer technician math plays a key roll as the numerical values of components and systems are important for proper operation. Whenever a system fails it will need to be fixed, which is accomplished by the act of troubleshooting. The troubleshooting process can be benefited by using statistics. Statistic provides a mean for determining the probability of a parts likelihood of failure, which can speed up the troubleshooting process.

Hello world!

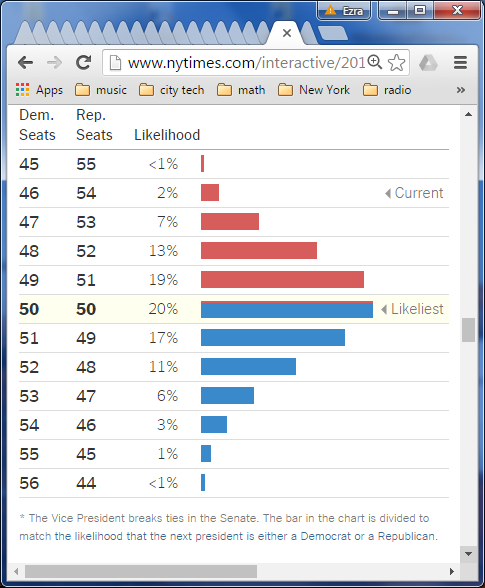
Statistics is all around us and this fall, we will be subjected to a bombardment of media coverage profusely sprinkled with projections, predictions and poll results. Look at the following graph:

senate

It represents the probability distribution for how the Democrat/Republican numbers in the Senate will end-up after the elections (as predicted by the New York Times). Presently, 54 members are Republican. The most likely scenario is that the election ends with a 50-50 split. If that does occur, then the vice-president would cast the tie-breaking vote. In other words, the Senate would be controlled by that party which is in the White House.

Since we are not in a political science course, for us as Statistics students, what is most notable about the graph is that it follows the classic shape of the normal curve, most famously pictured by our avatar,  the Galton Board:

GaltonBoard

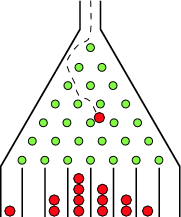
This is a clear illustration of what is called the Central Limit Theorem, basically, that a sum of many random events often results in a bell-shaped curve.

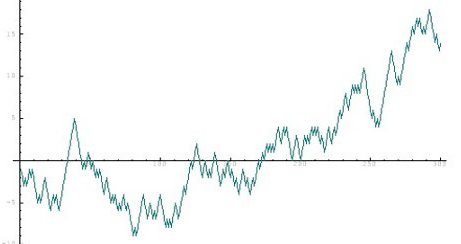
Also in the NYT article is a time series graph showing how the chances for the Democrats to take the Senate has fluctuated over the last few months:

senate_time_series

For us, it shows the existence of randomness.  However, let’s compare this graph which clearly shows the existence trends, momentum and spurts with our header, a simulation of coin flipping where we keep track of the balance between the number of heads and tails (say the difference):

This looks a more like a stock price trajectory. The phenomenon of reaching high highs and low lows is known as the gambler’s ruin. In a nutshell, in a “fair” game, the person with the most resources is likely to win as they are more likely to survive the extremes.

Can you program a simulation to look like the control of senate race? Perhaps the chance of going more in a direction (up, down or the same) will be weighted more than going in different direction.