Assignment #2

The article’s title is “When You Hear the Margin of Error Is Plus or Minus 3 Percent, Think 7 Instead,” by DAVID ROTHSCHILD and SHARAD GOEL. This article is about that the common knowledge for the people who follow election polling (human research survey of public opinion from a particular sample) is that there is plus or minus three percentage points of margin of error when 1000 people are surveyed. This ±3% is coming from the following formula that is found in statistics textbooks; percentage points = 1/square-root(sample size).

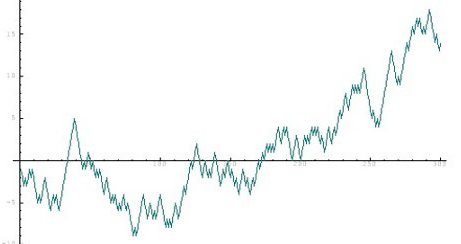
But the real margin of error –based on the history of campaign polls- is actually about six to seven percentage points; 4221 late-campaign polling averages (the result of synthesizing combined information, from many different polls that deal with the same issue, into a new set of numbers) were examined; “608 state-level presidential, Senate and governor’s races between 1998 and 2004.” The following graphs show “how the Republican candidate performed in races since 1998, compared with the average of all polls conducted in the final three weeks of the campaign.”

picture3 picture2 picture1

In other words, the results of these polling averages are just assumptions that are not accurate and can be reversed in any time as the elections progress. This is due to the errors that cause the big gap between both margins of error (±3% and ±7%), the 3% error covers the non-perfect representation of the full population even when the participants in the survey are selected randomly. But it doesn’t cover other errors such as frame error, nonresponse error, and the error in the analysis phase. These errors show up in two ways, one is that the variation between the polls is bigger than what’s in textbooks, second is that polls tend to overestimate or underestimate the true value.

The graphs above are used in this article as a reference to compare the average of all polls and the final election outcome which appear to be different. In other words, the margin of error of 3% is not correct; if the sampling variation was the only error, then the difference between the polling average and the election outcome would be smaller. Based on standard theory, averaging many polls will shrink this difference, but in reality, the difference persists in 2% and that is due to the similar assumptions made by survey organizations about who will vote.

In conclusion, the polls are just estimations about who will win the campaign, which are projected to changes any time before the election day, but only the election day will reveal either Mrs. Clinton or Mr. Trump for a president.

Reference: http://www.nytimes.com/2016/10/06/upshot/when-you-hear-the-margin-of-error-is-plus-or-minus-3-percent-think-7-instead.html?_r=0

Assignment #1

http://parks.slu.edu/myos/my-uploads/2013/04/11/electrical-engineering.png

My name is Andres. I am majoring in Electrical Engineering Technology. In my major, math plays a key roll as basically everything revolves around numbers and math in general. The values of components such as resistors, capacitors, etc. are all determined by mathematical numbers. Whenever a system or circuit don’t work properly, we are tasked with finding the solution to this problem. The process for finding this solution is known as troubleshooting. It can be said that the troubleshooting process uses probability & statistics. For example, statistics and probability can provide you with a way of determining the probability that a specific part or component has of failing. By knowing these stats and probabilities, the troubleshooting process can be made much easier.

Assignment 2: News article graph

chart

https://finance.yahoo.com/news/gutsy-analyst-argues-that-already-expensive-stock-prices-will-get-even-more-expensive-123829662.html

This article is from a report that appears on Yahoo!Finance on October 13, 2016. In this article the reporter discusses an analysts argument that stock prices will continue to increase. The analyst points to several factors such as; companies being more efficient at generating more free cash, a lower than normal volatility amount stocks, the various sectors are reasonably priced, and the return on capital is higher than that of highly rated bonds. The chart pictured above was used to display the comparison of the total shareholder yield of stock on the S&P  500 with that of a 20 year BAA corporate bond yield.

Assign #1

images

Reference http://www.learnabout-electronics.org/Resistors/resistors_19.php


Hey viewers! My name is Terry my major is electrical engineering. This field requires a considerable level of thinking and patient to achieve a certain goal. Since the beginning of this journey, most of my classes been about numbers and critical thinking   which are really resourceful. Lately, I have been using statistic to determine the final state of a series -parallel circuit when there is an open, short or at normal stage. When I talk about final state I refer to the electrical power of the circuit that can be defined as the relationship between the voltage and the current or the current and the resistance of the circuit. The image on top will give you a better understandinf of my point if you ever want to further examine my idea.


Written Assignment


gold

Hello everyone, my name is Giovanni and I am currently pursuing a degree in Computer Science. Probability is related to computer systems and programs in numerous ways. For instance, I could design a simple text-based RPG that uses a probability-based system for determining the item a player would receive upon looting a defeated enemy, or the amount of damage dealt upon attacking an enemy using a random function within the parameters of 1 to the player’s strength value.

large_1380344814

Hello everyone! My name is Rushdha Rafeek and I’m a graduating student in Mathematics Education. I exhibited a strong interest in mathematics over other subjects ever since I was in middle school and its been three years in college now and teaching math is my career focus. In order to become a math educator I need to have a knowledge on a wide range of topics and that includes probability and statistics. It is evident that probability represents real life mathematics and also connects other subject areas particularly counting and geometry. The main use of probability is to help us make important decisions in life. And as a prospective math teacher I believe students must learn the subject as it enhances their problem-solving skills and also engage them in learning experience through which they are able to construct their own understanding of probability concepts.

Picture source:  https://dqam6mam97sh3.cloudfront.net/video_photos/0/219/large_1380344814.jpg

Online Assignment #1

20160401_124401

My name is Saloua Daouki. I am getting my Bachelor’s degree in Math Education very soon and I am working on my initial certificate for teaching math to 7-12 grades. One of the requirements to get the initial certificate is to pass the Content Specialty Test (CST) in math which is about knowing math and how to teach it, and part of the mathematics concepts that is covered in the CST is probability and statistics. In addition, as a math teacher, I need to learn probability and statistics as one of the mathematics aspects -that every math teacher must know- in order to be able to help my students discover the power and the beauty of mathematics. For example, the photo above was summary of one part of one of the lessons I taught in high school last semester within the unit of probability and statistics.

Writing Assigniment #1

pic

Greetings, my name is Richard Mohandatt and I am currently working towards achieving my Bachelor of Science Degree in Applied Math. With my career goal fixed on becoming an Actuary, probability and statistics plays a major role in my future. As becoming an Actuary it requires the skill set of a business professional who analyzes the financial consequences of risk, using mathematics, statistics, and financial theory to study uncertain future events. I look forward to obtaining all the knowledge I can in this field as I put it towards attaining my goal.

Assignment #1 9/24

p3_showing_25c

Hello my name is Anthony Puca, I am currently working towards a bachelor in electrical engineering. I think that statistics and probability can relate to my career. I think that statistics can be used to determine the design decision for a circuit. It is more statistical in a circuit that a certain wiring will cause an outage in a system.  Another way statistics and probability be used is when you are designing a circuit, and you want to know what certain parts of the components will most likely fail. Like if the items that your order for your design didn’t come from a good manufacturer. And what would be more likely a domestic component will fail compare to the components from over seas.

First Writing Assignment

Me an my text editor of choice

Me and my text editor of choice

Hello. My name is Justin Wong, and I am a studying Computer Engineering. I’ve had interests in both hardware and software, so I believe that this was a middle ground between Electromechanical Engineering and Computer Science. Though I don’t have any particular career in mind, I do know that Probability and Statistics Is related to both general engineering practices and computer security.

Continue reading