Success Stories & Program Advantages

I had to put the task of updating the social media pages on hold because they want to finalize all of the website pages that needs updating. Once we are finished we will then be meeting with the web programmer.

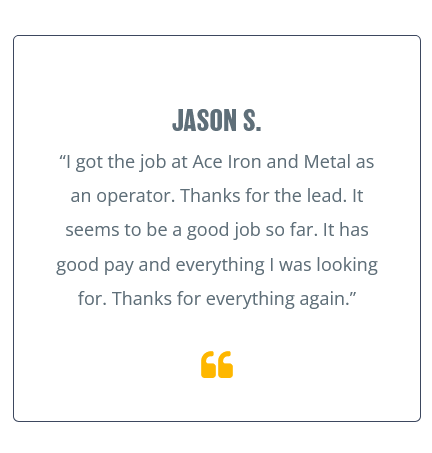
I was given two new tasks which I am excited about. The first one involves updating their Success Stories page. This page contains stories from past clients but it’s outdated and too long to read. The Director feels their stories give out too much personal details and would prefer just seeing quotes, similar to below, from the clients to give impact. I agree with this and will be coming up with several design layouts for them to choose from.

This brought back memories when I took my UX/UI design course. The Professor explained to us about the problems of information overload and this website explained it more. While sometimes it calls for to read long stories on how someone succeeded this is more for blog sites. My organization is interested in getting new clients so they want to share quick and relevant information so that visitors can click the enroll button.

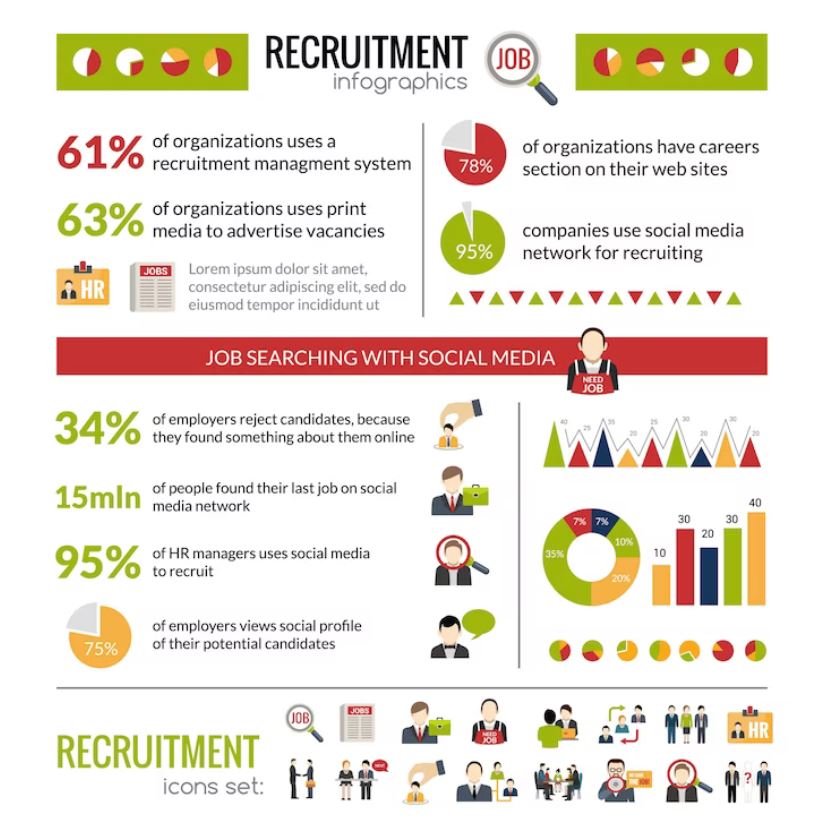
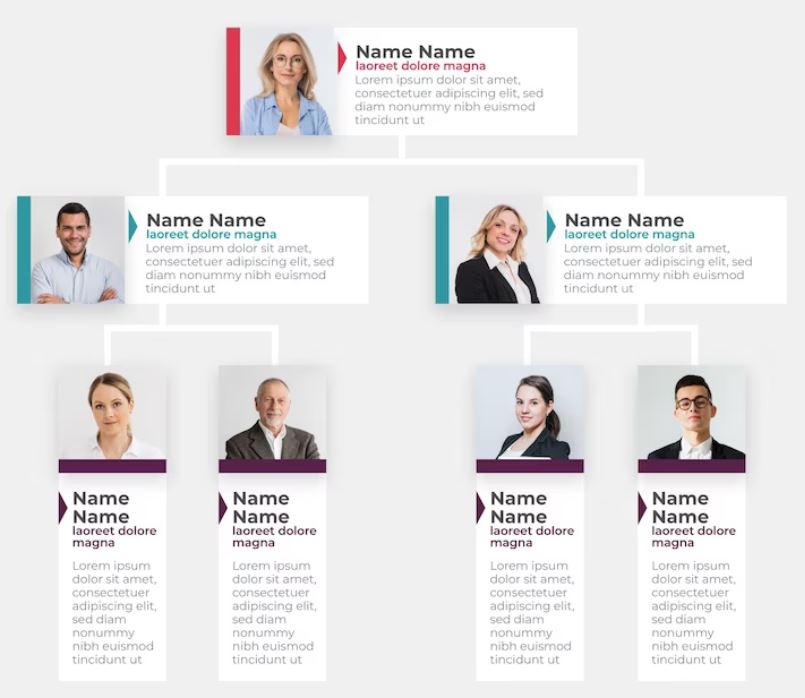
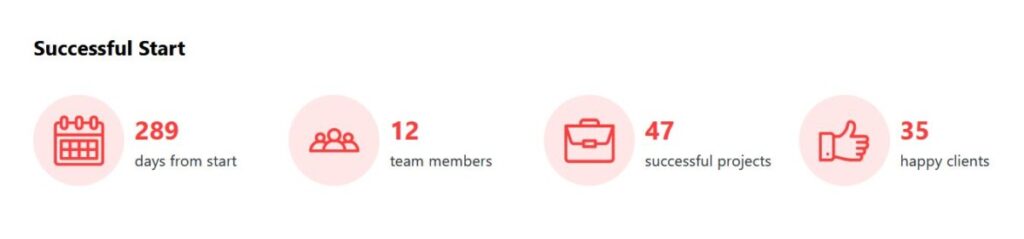
The second task is a creation of a new page they named employer message mapping. They want an infographic page that will show each of their program’s slogan, competitive advantages and specific examples about the advantages which contains numbers, similar to below. This is great because potential clients will like to see how their programs helped others in numbers.

Source: Image by macrovector on Freepik

Infographics Timeline

Prior to our in person meeting, I did research on info-graphic timelines. My supervisor wanted to show visitors a history on their organization with photos and their future goals. I came up with a solution to display this data in a vertical infographic timeline similar to this timeline:

Source: Visme

I ended up showing them five different layouts to choose from.

Social Media Platforms

Social Media Platforms English Kathy Wilson

Social Media Platforms Spanish Kathy Wilson

Software produced Audio and Translation

The last of the three tasks involves coming up with a cohesive design for their social media pages. They currently have 3, however, they all look different without any visual appeal. I aim to come up with cohesive banner designs for all their social media pages. I will offer them two solutions, a single design for all three, and 3 different designs that will show they belong to the same organization.

As an example, the School of Visual Arts uses cohesive branding across its social media platforms as seen in these screenshots:

School of Visual Arts YouTube Banner. Source: YouTube
School of Visual Arts Instagram Badge. Source: Instagram
School of Visual Arts Facebook Banner. Source: Facebook

My organization currently do not have a logo, however, I plan on designing a circular label type of logo they can use for their social media pages.

Organization Infographics

The second task was to come up with a new layout design for the Staff page. Their current staff page is outdated with past employees and there is no organization. I was excited about redesigning this page because I wanted to do something fun and engaging. Since they admire info-graphics, I wanted to incorporate this feature into their new design. After doing research on layouts I came up with a solution to display the staff in an Info-graphic organization chart similar to these charts:

Organization Chart 1
Organization Chart 2

Although the first one is more fun visually, it really doesn’t leave room for them to add short bios. The second chart is more efficient for their needs. I decided to show them several layouts to choose from.

Affilates Page

After our first meeting, I was emailed with the items we met about and was given three tasks. The first task was to come up with a new layout design for their affiliates page. Currently they have logo links from all of their sponsors and partnerships. Their are several design problems with this page such as missing logo images and no organization. After doing research and obtaining all of the logos for their page I came up with two design solutions.

The first solution was to organize all of the logos in order by the name of the organization and display them in grid format similar to below:

Since all of the logos were in different dimensions, I solved this by making all of the boxes the same size with a background color to match the logo’s background. While this solution was similar to what they currently have, it was missing information. The majority of the logos were typography based, however, a few were not recognizable. This led me to design another solution in where the layout contained the logo, the title of the organization and a short bio about the organization. This will give visitors knowledge about their sponsors and partnerships.

My First Meeting

I was elated to finally meet my internship supervisor and one of her staff in person! They gave me a quick overview of their organization and I learned additional information I was not aware of. For example, when they accept a client, besides training them they also teach them how to dress for success. They make it clear to clients that they offer so much than just training and finding employment.

After, we went over the main goal of updating their website. They showed me all of the pages that needed updating and future enhancements. For example, it is very hard to find their contact page so they want to add contact forms for each of the programs they offer. The plan is to have all of the programs listed on one page with a link to the contact form. This way the data will go directly to the person overseeing the program. Another nice feature they want is live chat similar to this:

Source: The New School

This will allow the staff to communicate instantly with a prospective client. I advised them to install it minimized so that people are not distracted or annoyed by a popup window. When no one is available, visitors will be able to leave a message with their email.

We also went over their social media sites and my design ideas.

Infographics Counter

I was somewhat anxious about getting started because time goes so fast during the semester and my supervisor hadn’t given me an assignment yet. She got in touch with me and basically explained what their current goals was. Although they have great programs, their online presence is in need of a makeover. Their first goal is to update their website so that it matches with the college’s overall theme. She explained to me how they had already started the process of updating their website by contacting the college’s web programmer. They were shown some templates to look at and to choose from. After I informed her that I would work with the programmer, she had some questions about extra features she wanted for the site. One feature is for visitors to be able to see how many people they serviced and how many were placed with jobs. I informed her this sounded like a script or info-graphics and she was delighted.

My first task was to do research. Although info-graphics can accomplish the goal, it is not feasible to keep updating the graphics as the numbers change. I wanted to find something that anyone in her organization can easily update on the back-end. Since I have prior years of experience working with WordPress sites, I basically knew what to look for. After doing research I found the perfect script for the website, shown below.

Source: Example Counter by https://elfsight.com/number-counter-widget

The great news about this script is that it only takes a minute to update the stats on the back end. Once you save it the data is automatically updated on the website.