Author: Javier Garcia (Page 1 of 3)
Public health has been an underlying theme of epidemics and pandemics since the beginning of time. There may be more pandemic situations like the one that is currently occurring due to the COVID-19 virus. Before COVID-19 what was mostly on the news was H1N1 in 2009 that I mostly remember and the president on that time “Obama” had a team behind the small pandemic in the USA, that handled the situation great. But if there wasn’t a team, anyone behind it or a mathematical system to handle and contain the situation would have a catastrophic effect on global public health, society, and the economy. Governments may be compelled to enact and support restrictive measures to stop the spread of disease in a pandemic crisis. So, what are best ways to maneuver such a action? That way this doesn’t happen again, and the world doesn’t have to be on hold while society is crumbling financially. What can we do or steps to figure out in theory or not this spread? Well, it’s right in front of us, Math!
In many disciplines, including physics, engineering, biology, and economics, differential equations are a crucial tool too for simulating real-world issues in our everyday life. They (Differential Equation) are used to explain the connections between variables that vary constantly over time, such as population increase, fluid movement, and electrical circuit behavior, which close resemble to what I just mentioned was the first project “Cooling and Mixing”. In this study, we investigate the use of differential equations to describe the transmission of infectious disorders like COVID-19 or H1N1 in 2009. In this section, we will concentrate on a specific class of differential equations known as the SIR model, which is frequently used in epidemiology to comprehend the dynamics of disease transmission and to forecast upcoming epidemics. That was the first choice I picked from the top of options on Open lab for this project. The main reason why I picked this, I was halfway into finishing my nursing degree and I will not forget this topic!
Real-World Issue: Infectious illness transmission is an important global public health issue, like in 2020. For the development of successful disease preventive and control measures, it is essential to comprehend the dynamics of disease transmission. To capture the key aspects of disease transmission and forecast the trajectory of an outbreak, mathematical models like the SIR model are used. The Susceptible (S), Infected (I), and Recovered (R) groups in the population are the foundation of the SIR model. The S group includes those who are prone to infection, the I group includes those who are already infected, and the R group includes those who have recovered and are no longer prone to infection.
Differential Equations Involved:
The SIR model is described by a system of three ordinary differential equations, which describe the changes in the population of each group over time. The equations are as follows:
dS/dt = -βSI
dI/dt = βSI – γI
dR/dt = γI
The book doesn’t give much on it, which I went out of the way to add a formula that had more information on understanding the formula and going over some real-life solutions. The book “Elementary Differential Equation 12-2013 by William F. Trench” Page six under Spread of Epidemic, doesn’t have extensive data.
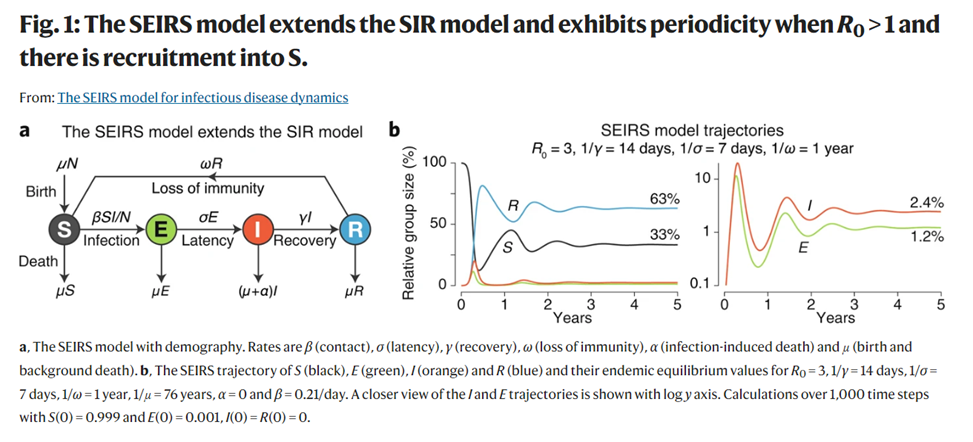
Using an assumed population at risk with random mixing, the simple yet essential SIR has been applied to produce or provide significant insights regarding the evolution of a new pandemic. These will enable us to simulate significant elements including birth, mortality, immunity decline, and aging. After contracting the infection, people will transfer to this group at a rate of SI/N and stay there for an average of 1/o before transferring to the I group. Immunity during recovery from many respiratory diseases is transient; recovered persons will regain immunity and return to S after an average protected period of 1/w. This is the fastest, shortest way to explain the steps of the SIR model in a real-life scenario. The differential equations of the SIR model can be resolved analytically or numerically to obtain a mathematical description of the dynamics of disease transmission. Analytical solutions are only workable for simplified versions of the model, whereas numerical solutions are more flexible and can handle more complex situations.
Utilizing a computer program that mimics the system’s behavior over time is one potential method for obtaining a numerical solution or problem. There are several computer programs that help either predict or find the precise information that is needed. With an initial population of S, I, and R, or SEIR (Susceptible-Exposed-Infection-Recovered) the program would simulate how the population would change as a result of the differential equations. The software can either come in packages such as MATLAB, R, Python, and Simulink, among others. The software could then be used to forecast how an outbreak would develop in various scenarios through time, such as changing the parameter values for or the initial population levels.
Interpretation of the Solution: Starting from an initial situation, the SIR model’s solution shows the population’s evolution over time. The S, I, and R curves display the sizes of the S, I, and R groups in relation or regard to time. The SIR model predicts that as people become infected, and no, not zombies, the S group will initially start to decrease while the I group will rise. The R group will grow as the infected individuals recover and progress immunity. When the population is largely made up of people who have recovered from the illness, and the number of afflicted people drops dramatically, the epidemic will eventually come to an end.
This all depends on also many other factors, but that isn’t added to the equation because there are many other equations for the other probabilities like big cities and weather. The other parts of the equation stand in for the demographic group’s change rates over time. The expression dS/dt indicates the rate of change of the S group, dI/dt is the rate of change of the I group, and dR/dt is the rate of change of the R group. The variables and expressions, respectively, because respectfully need to be used in many of the math problems, not disrespecting it respectfully the rates of illness transmission and recovery. The rate is indicated by the word SI. But the real question is why is this still important to use or have?
We need differential questions in the SIR model to save humanity, and I do hope we still have any humanity left in this world. The importance of controlling and understanding the spread helped us battle what we tackled in March 2020, in which many of us had a hard time understanding the situation. But, if we just had some knowledge like SIR Model, maybe not thoroughly study it but get an idea, we can avoid catastrophes like this so it won’t happen again.
Reference:
Cabrera, M. et al. (2021) An SIR-type epidemiological model that integrates social distancing as a dynamic law based on point prevalence and socio-behavioral factors, Nature News. Nature Publishing Group. Available at: https://www.nature.com/articles/s41598-021-89492 (Accessed: April 19, 2023).
Scipython. (n.d.). The SIR epidemic model. Retrieved April 19, 2023, from https://scipython.com/book/chapter-8-scipy/additional-examples/the-sir-epidemic-model/
“The Sir Model for Spread of Disease – the Differential Equation Model.” The SIR Model for Spread of Disease – The Differential Equation Model | Mathematical Association of America, https://www.maa.org/press/periodicals/loci/joma/the-sir-model-for-spread-of-disease-the-differential-equation-model


Recent Comments