Author Archives: Chapman

Questioning Authority

It seems that in this time that we are living in now, there seems to be no authoritative figure when it comes to information and whether or not it is valid information. Mezaros discusses a case between students and faculty, where s(he)? discusses how little students have respect for information received by people of authority in schools or universities. Maybe when you were a student in whatever institution of learning, you’d often see that one smart (sometimes arrogant) student in your class who’d often raise his hand to correct a teacher because he or she taught the information they presented was not entirely wrong, but there was a big mistake. At the end, the student would probably get schooled. Another example is that you’d also quite often see on social media platforms where the expressing of an opinion can be a “wrong opinion.” There is a video and in the comments section, there are about 10 users arguing over some silly idea. One user usually trys to start an argument and cause a reaction. At this point in time, it is usually those 10 trying to lay down some facts to prove their opinion and others saying that the other’s facts are wrong and baseless, etc. So we can see there really is a question on authority in terms of information. It seems that all facts are usually false without providing more facts, and those facts are false without even more facts, and the cycle goes on (to some point where everyone can agree, but that’s usually, if ever, hardly the case because everyone wants to be right).
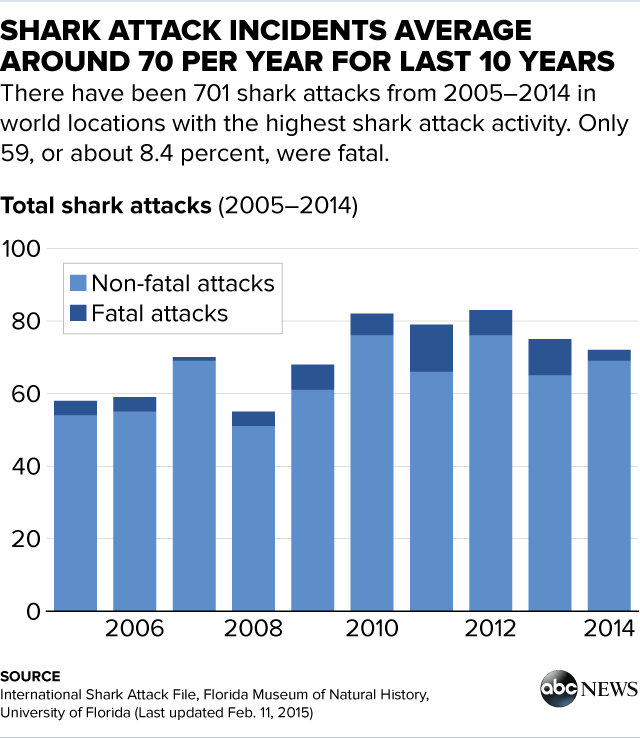
 

Graph on Shark Attacks, Joel Chapman

After a shark attack incident, Florida Museum of Natural History at the University of Florida decided to create some data sheets on the amount of shark attacks that has happened between 2005 and 2014. The graph above is just one of few graphs. It was hard for researchers to exactly tell the accurate amount of attacks, but they were able to tell that the majority of attacks were dealt by Great White sharks, followed by tiger sharks, and then bull sharks. Based on the graph, one can see that since 2005, the amount of attacks had increased, reached a plateau by 2012, and then has started to decrease. One can say that a factor of the increased shark attacks was due to the popularity of surfing increasing over some period of time, as it is known that sharks tend to spontaneously jump an attack preys. Based on the graph, you can assume that after the high amount of attacks in 2007, people had decided to stay out of the water the following year, and in the end did not notice many incidents. After, they decided to enter back, thus increasing the number of victims. These are nothing but speculations, but if one knows about Florida and shark attacks, some things will correlate.

Stats and probability relate to my career in becoming a professor to a high degree. Stats and probability is pretty much used in everyday life, especially when its comes to grading tests, figuring out averages of tests grades, creating percentages for a grading rubric and so much more. Unless I plan on teaching in this course, I am not sure how much more in depth I would personally have to go, but as for the basics of stats, I think its a standard that I at least must know

Stats and probability relate to my career in becoming a professor to a high degree. Stats and probability is pretty much used in everyday life, especially when its comes to grading tests, figuring out averages of tests grades, creating percentages for a grading rubric and so much more. Unless I plan on teaching in this course, I am not sure how much more in depth I would personally have to go, but as for the basics of stats, I think its a standard that I at least must know.