
Bar graphs are used to compare the rate of change throughout different points of time. They are also used to show results from different actions that were taken and compare what was accomplished with these acts.
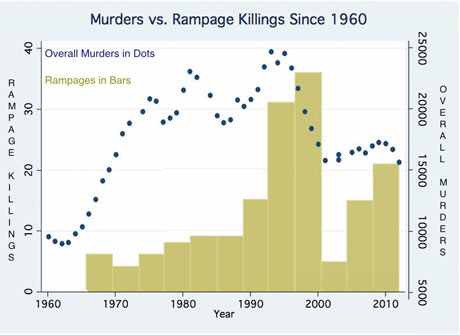
http://www.theguardian.com/commentisfree/2012/jul/21/colorado-shooting-james-holmes-history


Please follow the outlines of the assignment, which is to provide the source and describe the purpose of the graph in its original context.