5/20/2015
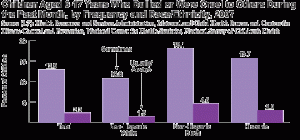
Elidania Santana: This is a bar graph showing the percent of bullying by race. This information is based on a national survey of children. This graph breaks down bullying by race; sometimes or usually/always are the 2 categories shown. Non-Hispanic Blacks have the highest rate of bullied or who were cruel during the past month by 18.1 percent.
Angelys Liriano: This graph is a very interesting graph because it is showing how bulling is increasing. Which is bad thing because it shows how different race act cruel to other children. Non-Hispanic White has the lowest rate of bulling with an 10.8 percent.


