There are several ways to keep track of your students’ progress in WeBWorK, we’ll talk about them in this post.
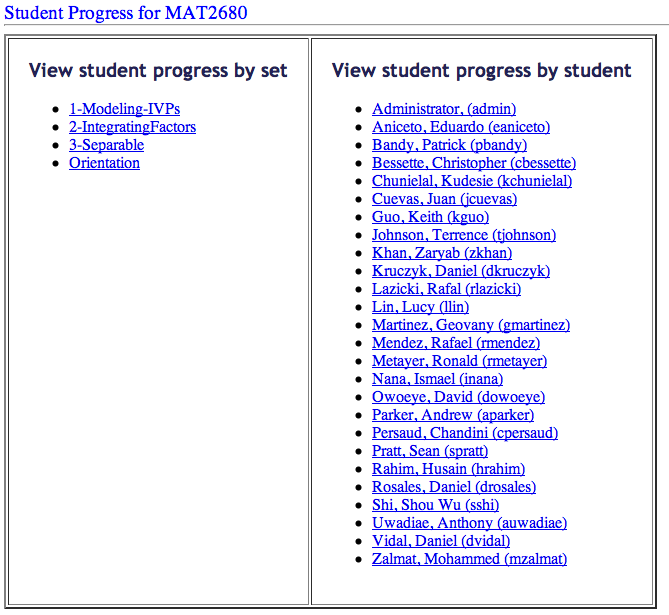
Informally, if you want to check in on the class’s progress on a particular problem set, you’ll want to click on “Student Progress” in the lefthand column (after logging in, of course).
By clicking on a problem set in the left column, you’ll be able to see a list of your currently enrolled students, as well as detailed information about their progress on this particular problem set:
For each student, there is a score out of 18 (in this example), a ‘success indicator, Ind‘, and then information about each problem in the set.
Detailed information about each of these items is given:
A period (.) indicates a problem has not been attempted, a “C” indicates a problem has been answered 100% correctly, and a number from 0 to 99 indicates the percentage of partial credit earned. The number on the second line gives the number of incorrect attempts. The success indicator, Ind , for each student is calculated as
100*(totalNumberOfCorrectProblems / totalNumberOfProblems)^2 / (AvgNumberOfAttemptsPerProblem)
or 0 if there are no attempts.
You can sort students by score or by Ind, and readily tell who has not been doing their assigned problems. It might be a good idea to invite such students to stay after class for a discussion about the importance of doing homework.
Alternatively, you can get information about the progress of a particular student by selecting a student’s name from the “Student Progress” page that we visited above.
You’ll be able to see that student’s progress on all assigned problem sets. You also have the option here of “acting as” that student. This means that while acting as them, you’ll see their version of all assigned problems (since WeBWorK randomly generates coefficients and such). This can be useful if a student comes to office hours for assistance.
If you instead want to formally download scores to enter into a spreadsheet for grading purposes, you’ll want to instead click on “Scoring Tools” from the lefthand column:
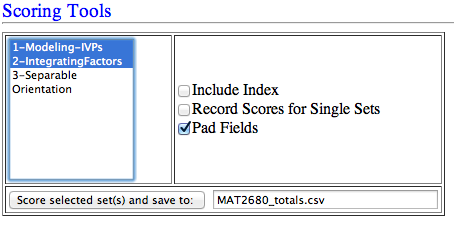
Select the assignments you want to include in your grading:
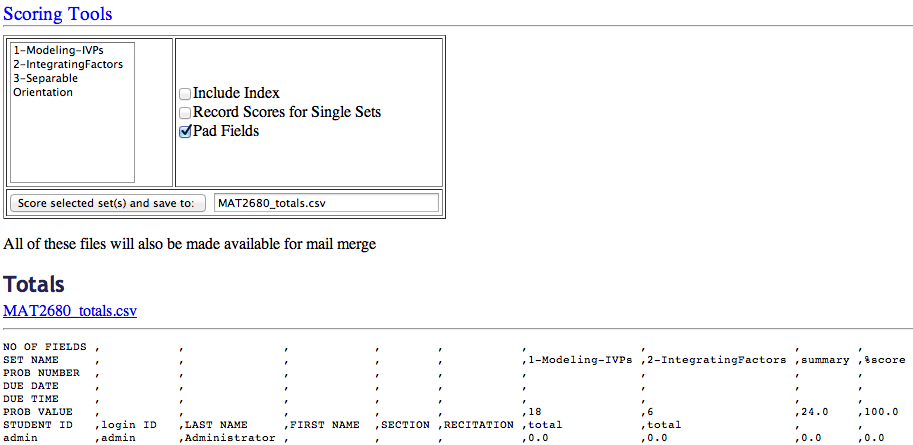
And click on “Score selected set(s)…”, the filename isn’t terribly important – you can change it to whatever you like.
The summary column gives the raw score (total points earned), and the %score column divides the raw score by the total points possible to give a percentage. This method of scoring means that a student who scores zero on a long problem set is penalized much more harshly than a student who scores zero on a shorter problem set. This can be balanced by adjusting the problem weights in each assignment to force each problem set to be worth an equal number of points. By default, each problem is set up to be worth one point. There will be a post in “Advanced Topics” to address how problem weights can be adjusted.
If you now want to import this data into a spreadsheet, simply click on the link between “Totals” and the beginning of the scoring table. In the image above, the link is blue, underlined, and reads “MAT2680_totals.csv”. This file, once downloaded, should be openable by any spreadsheet software, and from there may be copy-pasted into your existing grading spreadsheet.


