Meeting 5 was very informational and interesting. The presentation Professor MacDonald did on the course she teaches, as well as the resources the students use to gather data was very helpful. Each of the sources that the students use to find and gather the data, I have never heard of. Each site presents the data and compares shows the different variables that might change and affect it. I also like how the sites present information over time and allow you to see the different variables that contribute to the result. The fact that students have to discuss/ describe the data as well as speak on what the data means reminds me of a course I took a few semesters ago. It was SBS2000ID(Research Methods for the Social and Behavioral Sciences Interdisciplinary) and it focused on the research methods of gathering data rather than the data itself. Like the course Professor MacDonald teaches we had to choose a topic, however, it had to be related to our major and had to be able to be observed in the community we lived in. We discussed everything from ethics to different experimental methods to Cinematic Montage, Ethnographic methods, research studies, Case studies, and more.
The discussion we had after on the validity of data was insightful. The question of whether data is truthful and trustworthy is an interesting one. For me it’s kind of a gray area, most of the time we trust information coming from people that are knowledgeable in the field and that have the supposed data to back it up. For example, would you trust the information about a science-related topic from a friend who has taken a science course or from a scientist that has been in the field for 10 years? You would probably trust the scientist, despite knowing that your friend is trustworthy but at the same time, the scientist has experience and knowledge in that specific field. At the same time, people emit or dismiss data that might not back up their point. Also, two people that use the same data might have two different conclusions, despite using the same data. It all comes down to whether or not the data is provable and achievable. This was one of the points that was brought up in the book Information: A Very Short Introduction when discussing the difference between Semantic content and Semantic Information. Semantic content could be truthful as well as false at the same time, which is an amazing thought. In contrast, Semantic Infomation has to be undeniably truthful, well-formulated and backed with data.
The article on Big Data was very understandable and packed with information. It explains what Big Data is and its benefits for society. Big Data is considered to be part of a branch of AI, and it focuses on using math combined with information to create predictions. It was interesting to see how Google used Big data to provide Public Health officials with valuable information faster than the CDC. Big data software in order to produce this needs a big processing system and a massive amount of data.
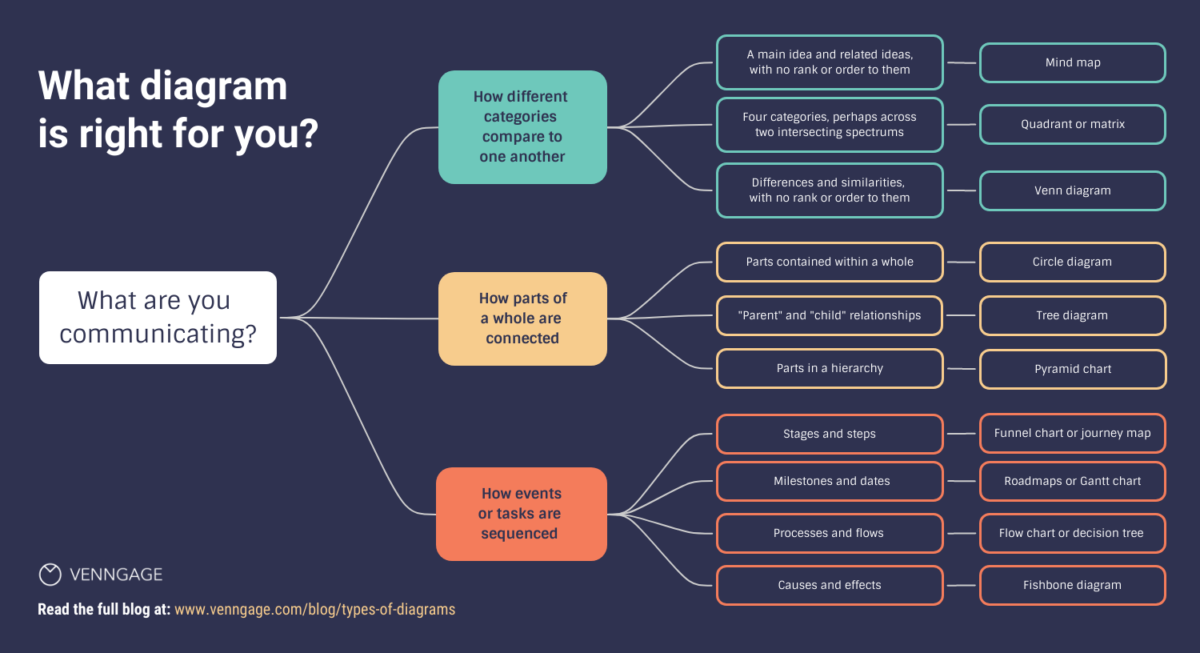
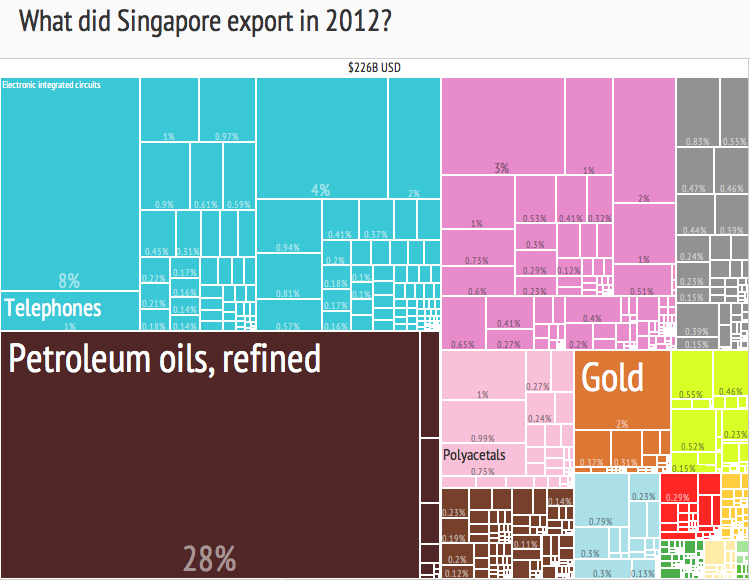
The 1st chapter in the new textbook, which speaks on hierarchy systems and how it is used in data visualizations was digestable to me. It contained information that I learned in my Information Design class with Professor Hitchings as well as points on cognitive/visual perception that we learn in most of our COMD classes. The chapter is easy to understand and the point is explained in depth that even those who are not in the COMD major can understand. So basically hierarchy structures are used to present data sets visually, in either stacked format or nested. The stacked format presents the data in order that shows the relationship to each other and is connected by lines. Think of it as a family tree, you start at one point and it continues to break down into parts as you continue down. In contrast, for nested the data is positioned within containers based on their independency and rank. It had the same meaning in CSS and HTML the content is placed in containers and is independent. It continues to talk about how we use spatial encoding and visual and cognitive perception in our daily lives. These are seen below.


Thank you for your very thorough post Winnie! Sounds like the SBS2000ID class was a great introduction. I agree with you on the insightful discussion that followed Prof. Macdonald’s presentation. There is this notion that because data is often based on a complex collection of variables and numbers it is accurate, but it’s important to keep in mind that people are always behind data – it is a very subjective process. No data is perfect. And as you point out it’s hard to know if there might be alternative interests that obscure data presented. I think it was brought up during the last class discussion that we rely on a certain level of ‘truthfulness’ in content creators for a productive society to function. This speaks to the need for protecting high standards in professions like journalism, science, government institutions, non-profit organizations, etc. A good journalist in theory has their reputation at stake. So finding sources that are ‘known’ to be reputable is important. And of course what does it do to trust when a reputable source lies (or makes a mistake?). The Society of Professional Journalists for example publishes a Code of Ethics that is meant to establish standards – and is worth taking a look at.