Chapter four of the reading was not in the Dropbox, so I found it in the City Tech Library.
https://ebookcentral.proquest.com/lib/citytech-ebooks/reader.action?docID=737413&query=information+a+very+short+introduction+: Week 4 Journal- WinnieI found Chapter Four of “Information: A Very Short Introduction” fascinating. After what I learned from the sessions with Professor Cabo, the reading was very digestible. Chapter four speaks on Semantic Information, which at first was a bit confusing because they also spoke on Semantic content, but it made sense as I continued on. Professor Cabo spoke on the different types of information, physical which is formulated for storage and not dependent on meaning, behavioral which affects human conduct and finally semantic. This chapter focused in depth on the latter.
Semantic Content is something different from Semantic information. It can be either instructional, for example, reading instructions from a manual. Or it could be factual. Interestingly enough despite it being factual, it could also be false. In contrast, Semantic information is “truth constituted”, meaning it cant have no fault. Semantic information can be factual if and only if it is well-formed, meaningful, and can be proven by veridical data. Veridical data is considered to be responsible data and is a way to find reliable and reproducible information. It also spoke on Semantic Information’s connection and relationship with knowledge. Since factual Semantic information can only be based on truth it is parallel to knowledge. The video below also helped me understand Veridical Data more.
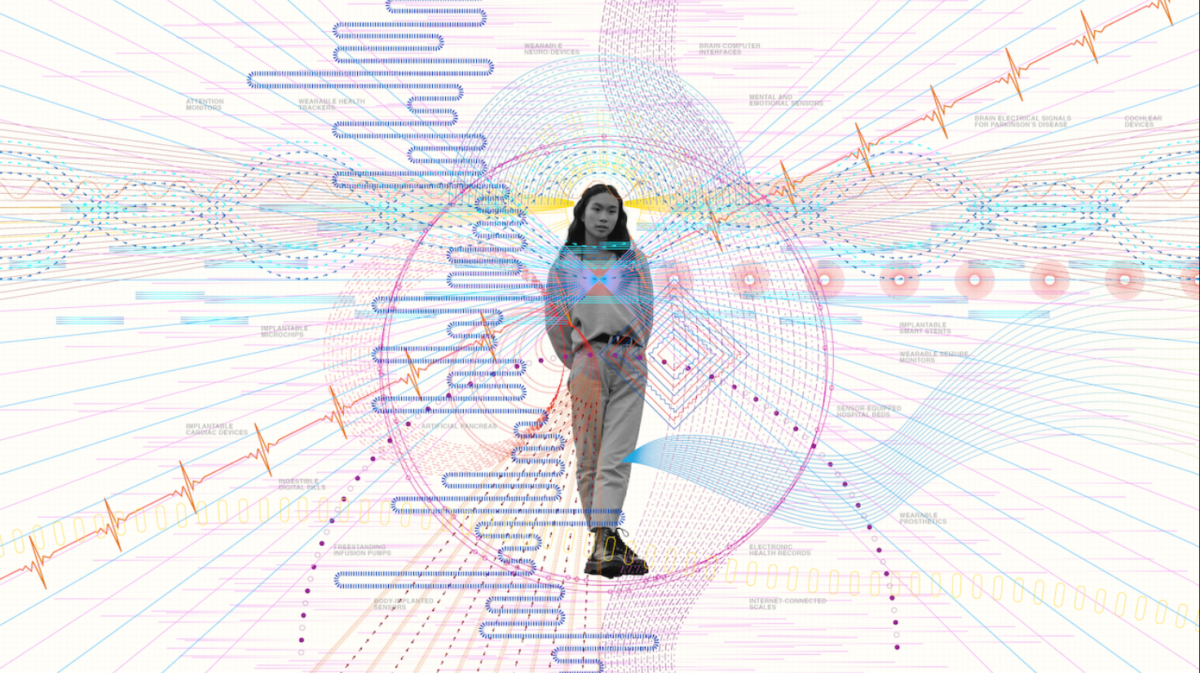
The article “Design for Information: An Introduction to the Histories, Theories, and Best Practices Behind Effective Information Visualizations, was a combination of visual images and very little text. It spoke on how designing for informing differentiated from other graphic designs. It requires analytical and visual/spatial methods of measuring and presenting it in a way that is understandable and relays important information. It needs to contain both cognitive and visual perception to relay information to the audience. That reminded me of an artist I learned about a few semesters ago. The work of designer Giorgia Lupi encompasses both those aspects. Her work simply contains tons of information and data that is relayed to the viewer. Below is a work of hers on the use of technical devices using data visualization. Also, the article link to see all the parts of this work is below.
Here are some other resources that might be helpful to freshmen to help them understand the material presented.


Hi Wilna,
I also was confused reading as well, I like to chop the readings up into sections and break the information up. I try to write about the parts I understand the most and seeing how I can go from there. I remember learning about Giorgia Lupi as well, that’s a great example and a lot of her work does resemble what we are reading and the images in the text.