assignment #2 Tenzing Sonam

Every year, as college graduation draws near, assessments of the job market get personal. Soon-to-be graduates compare their prospects and offers (or lack thereof) to those of their peers. Parents and other relatives start (or stop) worrying about whether their kids may move back home or need other forms of continuing support. On the one hand, the number of jobs has increased notably, if fitfully, in recent years, which should up the odds of a grad finding work. On the other hand, pay has long been flat, even for college grads, so entry level wages, on average, will likely be no better than they were for grads from 15 years ago.The graph in this report shows the average hourly wages of young workers, by education.The average for college grads, $17.94, works out to about $36,000 a year.

Unfortunately, there’s nothing in any economic data to indicate an upturn in wages anytime soon. The employment record for April, released last week by the Labor Department, showed persistent wage stagnation and even indicated a slowdown in job growth this year from the pace set in 2014

What to Watch on Jobs Day: Looking for a Pickup in Job Growth, Signs of Wage Growth, and a Glimpse at the Future for the Graduating Class of 2015


Pedro Acosta Assignment#1

My name is Pedro Acosta. I am currently studying for a career in Computer Science. Statistics w/ Probability is important for my career because 1) it’s required and 2) it helps in a way with coding. It also helps because Computer Science is basically a language, but with numbers. With Computer Science, I could create games using the “language” we learn, which are mostly numbers. Statistics is about collecting data on a certain topic, and which computer science we collect data and join them together to build things (i.e. in my CST test, he made us collect data and turn the information to build an ATM with)

Pedro Acosta Assignment #2

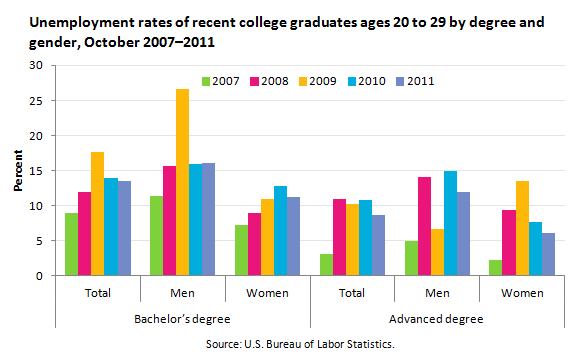
This graph is showing the Unemployment Rate for recent college graduates from October 2007-2011 through gender wise, from ages 20-29. It is also separated into two sections: Bachelor’s degree & Advance degrees. In all it shows the unemployment rate of men, women and both for each section. In all, men had a higher percentage in unemployment rate. In 2009, a little over 25% of men with a Bachelor’s degree were unemployed. Women with a recent Advanced degree in 2007 had about 2% of unemployment, but it increased, more than doubled, to almost 10%.

Assignment part 2

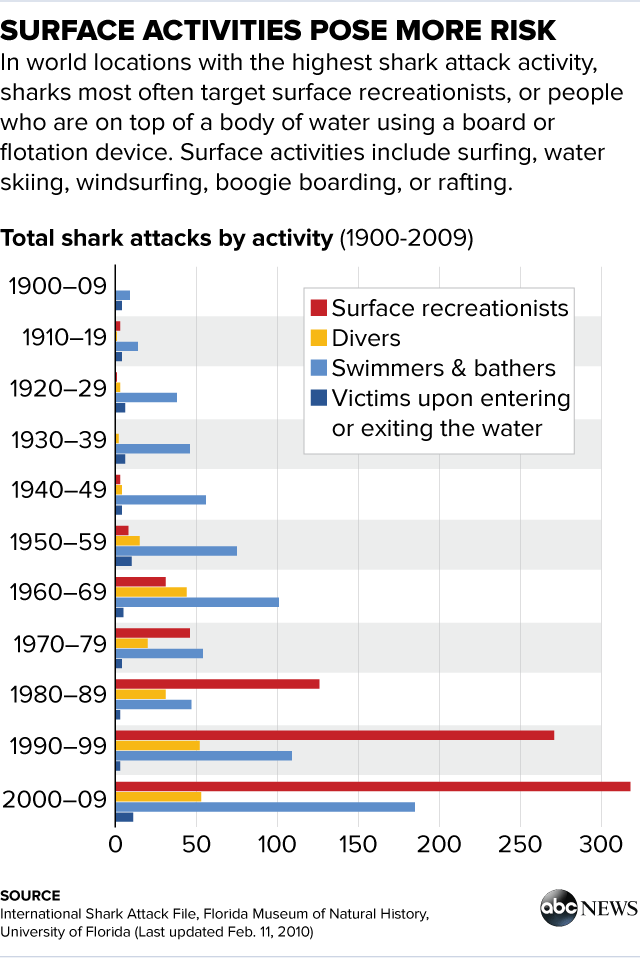
Data collected by the Florida Museum of Natural History at the University of Florida has broken down more than a century’s worth of shark attack data to put the most recent attacks in perspective. People who are using some kind of flotation device on the surface of the water have been the most frequently attacked individuals in recent years, according to their findings. The data shows that before such flotation devices, which include boogie boards, jet skis and surf boards became so mainstream, the people who were attacked tended to be swimmers and bathers. The graphs were used to explain the shark attacks, how frequent they were and which sharks attacked.

http://abcnews.go.com/US/shark-attacks-told-graphs/story?id=31779076

Underemployed College Grads post by Michael Sanchez

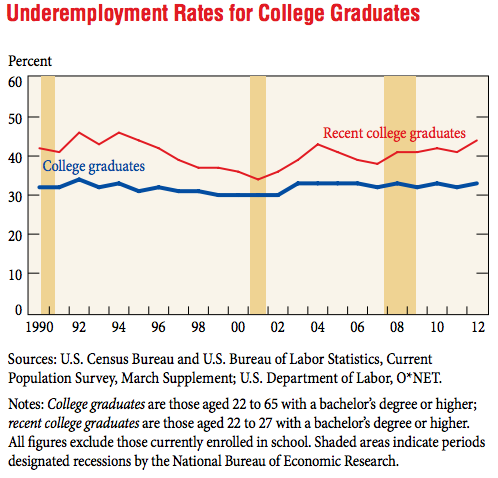
An article written by Jordan Weissmann on The Atlantic, tells about students becoming “underemployed” right after getting out of college. Underemployed meaning that their current job after college did not require their degree; this is where the majority of young adults are being employed. The study included young graduates within the years 22-27 and graduates that are above 27 to 65, the number of recently graduated students are constantly getting jobs that dont need their degrees. The article also brings attention to the jobs that are becoming available throughout the years. As the years are going by, the number of good paying jobs (45k a year) are declining, while the low wage jobs (25k a year) are rising. And this is where recent grads are ending up in, in the low wage jobs, that are on the rise. Ofcourse that is for the moment, but on the other hand alot of college students end up making over 30k over the years. Not many are stuck being baristas or walking dogs for a living for a long time but it sort of makes you wonder if your degree is worth it not.

The article has 2 graph’s but i’ll only use one for this post, the entire article lies here: http://www.theatlantic.com/business/archive/2014/01/the-growth-of-college-grads-in-dead-end-jobs-in-2-graphs/283137/

Online Assignment Part 2

3242

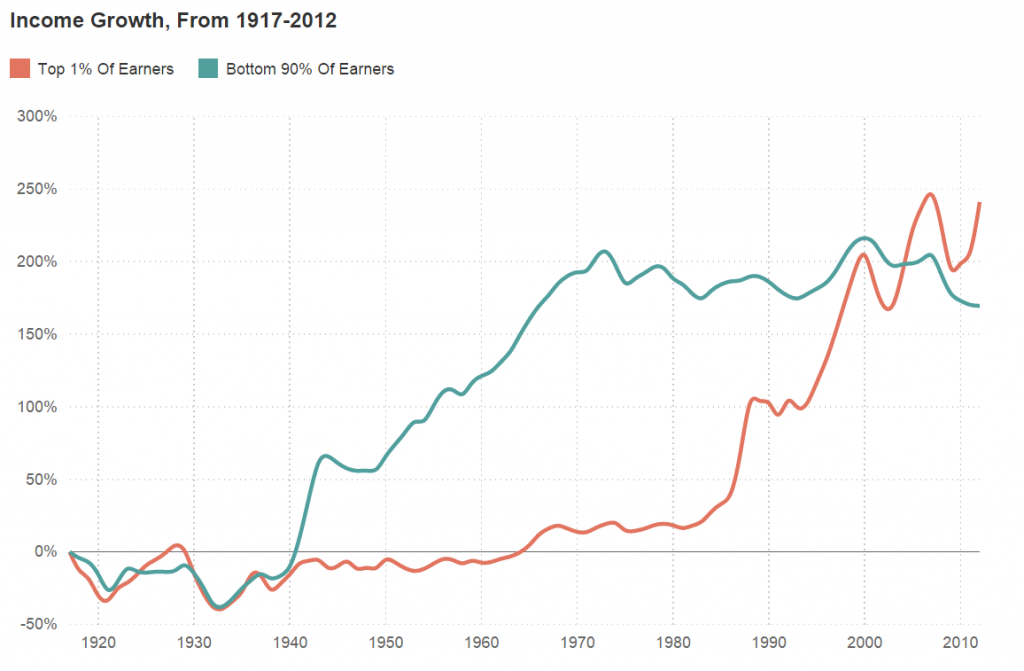
Description: This graph depicts income growth from 1917 to 2012. The author made sure to correlate his information with the chart above. By having his information correspond to the graph, the reader is then better able to understand the multiple trends in the graph above. Notably, an interesting trend can be seen from the graph above, from 1980 to 2010 income growth for the top 1 percent dramatically increased. On the other hand, from 1980 to 2010 income growth for the 90 percent has disturbingly stagnated.

Summary: In the article, “The Fall And Rise of U.S. Inequality, In 2 graphs,” Quoctrung Bui, the author, goes into detail about inequality in the United States. According to the author, a phase called the great compression was a time when incomes rose for the bottom 90 percent. On the other hand, also during the great compression, the 1 percent of earners experienced a stagnant income growth. The author then explained how during these past 35 years “marginal tax rates” fell, resulting in an income rise for the top 1 percent. Notably, also occurring during these past 35 years, the author said, “…a combination of global competition, automation, and declining union membership, among other factors, led to stagnant wages for most workers. “

http://www.npr.org/sections/money/2015/02/11/384988128/the-fall-and-rise-of-u-s-inequality-in-2-graphs

Graph about Unemployment Rate in Minnesota (Second Posting [Hannah Ally])

This article “In unemployment rate, a tale of two Minnesotas” by Bob Collins(MPR news) main focus was to cast an eye and find the cause of unemployment rate and in Minnesota. Over 5,000 jobs were lost and unless you were in health care, trucking, or the hospitality, you weren’t working. Also there are other major contributors to this great feat, which are longevity of unemployment, gender/age, and race. The race factor is mind boggling,people of color especially African Americans are discriminated against because the lack of education and a significant amount of criminal records in contrast to whites. “It adds additional support to a report last month that household income among blacks/African-Americans in Minnesota has plunged from 2013 to 2014. ”

Out of the three graphs that were presented in the article, I chose the graph on Ethnicity/ Selected Race. As you can see, African Americans have the highest unemployment rate, peak about 23% in 2011 with the low 10% in 2014. But you see that rate is rising again this year over 15%. For Hispanics the rate is gradually decreasing this year but the peak was for unemployment was 2010 at about 16%. Finally for Whites the graph shows the rate has roughly been under 5% and this year you can see that both Hispanics and Whites have come to a meeting point for unemployment at about 3% this year.

http://blogs.mprnews.org/newscut/2015/10/in-unemployment-rate-a-tale-of-two-minnesotas/

Posting two on Graphs

Jamika Russell

10/17/2015

The Article ” The Old are Working, but not the Young”  in The New York Times was based the difference between working as a adult and working while you’re a teen. Some jobs want their employee to be older with more experience and on the other hand some jobs want their employee to be younger with more energy to want more. In the article, the writer is trying to persuade readers that older people in this past year has received more jobs than the young. According to the article, it stated  that “During the summer months this year, an average of 35.9 percent of men ages 65 to 69 had jobs.”

http://mobile.nytimes.com/blogs/economix/2013/09/06/the-old-are-working-but-not-the-young/

Mohammed Hossain post 2

Mohammed Hossain

Instructor: Prof Ezra Halleck

Date: 10/17/15

Post No. 2

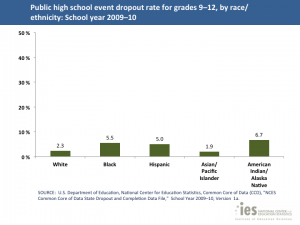
This is a graph that demonstrate dropout students rate in 2009-2010 based on ethnicity. According to ED’s National Center for Education Statistics provides state by state date on high school dropout. This graph shows that rate of leaving the school for Black student  is 5.5% ,  Hispanic student rate is 5.0% and the American Indian has the highest percentage of dropping 6.7% . On the other hands,  White  and Asian/pacific islanders has the lowest dropout rates.oooo


http://blog.ed.gov/2013/01/high-school-graduation-rate-at-highest-level-in-three-decades/


Mohammed Hossain Post .. How Statistics Relates to My career.

Mohammed Hossain

Instructor: Ezra Halleck

Math 1372


Hello, my name is Mohammed Hossain. At this point, my Prospective career is to become a computer scientist and a programmer. When I was in high school I really got interested in computer field. Programming is really fun and I love it. The most interesting part about being a computer scientist is you are able use computer to do many things such as explores new ideas, creating more breakthroughs and  use them in our daily life. Also, you can be a game developer build different types of games, websites, robots etc. I believe that statistics and probability plays a major role in every field especially in computer science. For example, computer science is like a giant calculator that computes all the data like statistics does. Statistics help computer to do the entire math faster, without statistics it will be hard for human to calculate the average of huge data. Then algorithm will be harder for human being because the main job of algorithm is to match raw data. In computer field we use both statistics and probability to do data mining, date compression, speech recognition, and data recovery and retrievals etc. Furthermore, Programmers use probability to measure the success of the program before running it. Probability is also used to solve paradox probability have been now playing a very big role in computer programming. Overall, statistics and probability deeply plays an essential role to the field of computer science.