Author Archives: Anthony Serrano

Online Assignment Part 2

3242

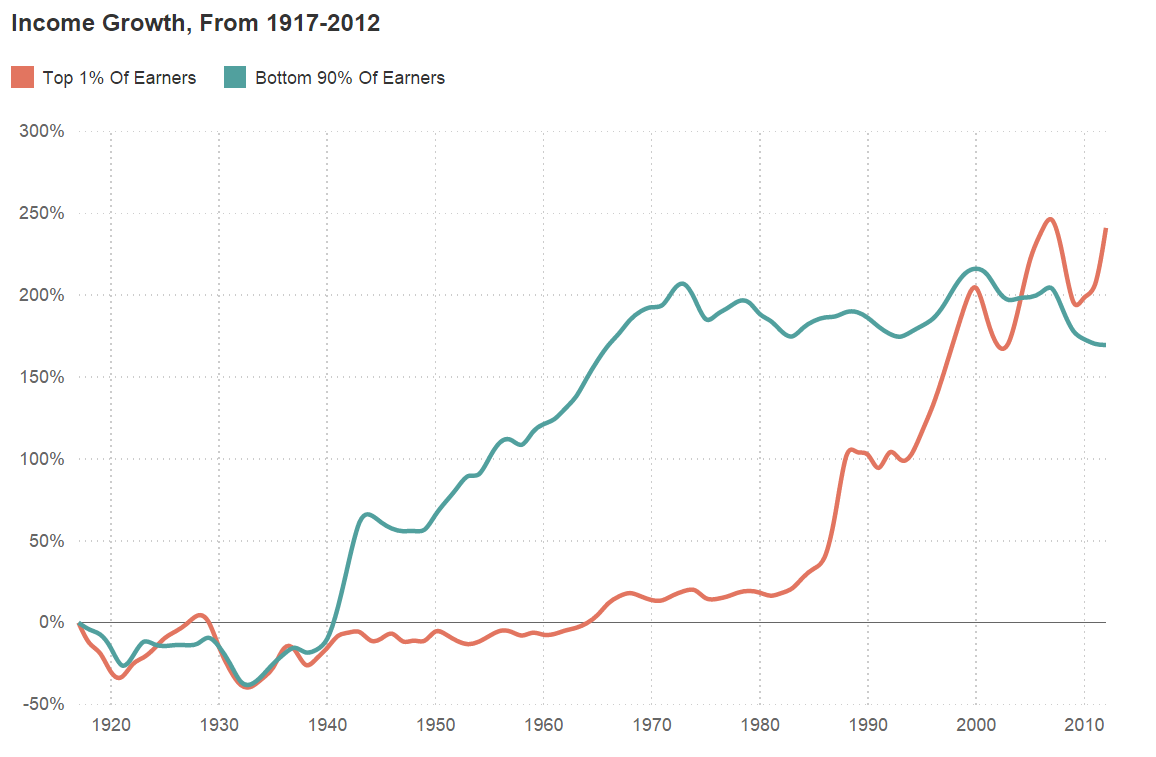
Description: This graph depicts income growth from 1917 to 2012. The author made sure to correlate his information with the chart above. By having his information correspond to the graph, the reader is then better able to understand the multiple trends in the graph above. Notably, an interesting trend can be seen from the graph above, from 1980 to 2010 income growth for the top 1 percent dramatically increased. On the other hand, from 1980 to 2010 income growth for the 90 percent has disturbingly stagnated.

Summary: In the article, “The Fall And Rise of U.S. Inequality, In 2 graphs,” Quoctrung Bui, the author, goes into detail about inequality in the United States. According to the author, a phase called the great compression was a time when incomes rose for the bottom 90 percent. On the other hand, also during the great compression, the 1 percent of earners experienced a stagnant income growth. The author then explained how during these past 35 years “marginal tax rates” fell, resulting in an income rise for the top 1 percent. Notably, also occurring during these past 35 years, the author said, “…a combination of global competition, automation, and declining union membership, among other factors, led to stagnant wages for most workers. “

http://www.npr.org/sections/money/2015/02/11/384988128/the-fall-and-rise-of-u-s-inequality-in-2-graphs

Hello,

My name is Anthony Serrano and my major is Biomedical Informatics!

As almost any other profession that you can think up of, Biomedical Informatics takes advantage of the mathematics field. Indeed, statistics can be a great tool to make sense of data and information. So what is data and information to a medical Informatician? Data is raw information, whereas information processed data.  Medical Informaticians usually derive their data and information from a health care system. By using statistics in certain ways, we can derive knowledge from information. And so we have the following: 1) Data is turned to information; 2) Information is then turned to knowledge.

By acquiring knowledge (i.e., to use for decision making) from the above process–using mathematics to make sense of the data and information–and using it effectively, health care organizations can cut down on their ever-increasing health care costs.  To address the ever-increasing cost of health care in the U.S., perhaps we can look to statistics to look for an alternative to Obama Care (PPACA 2010).

Anthony S.
Snapshot_20150927_204002