Tag Archives: graph

assignment #2 Tenzing Sonam

Every year, as college graduation draws near, assessments of the job market get personal. Soon-to-be graduates compare their prospects and offers (or lack thereof) to those of their peers. Parents and other relatives start (or stop) worrying about whether their kids may move back home or need other forms of continuing support. On the one hand, the number of jobs has increased notably, if fitfully, in recent years, which should up the odds of a grad finding work. On the other hand, pay has long been flat, even for college grads, so entry level wages, on average, will likely be no better than they were for grads from 15 years ago.The graph in this report shows the average hourly wages of young workers, by education.The average for college grads, $17.94, works out to about $36,000 a year.

Unfortunately, there’s nothing in any economic data to indicate an upturn in wages anytime soon. The employment record for April, released last week by the Labor Department, showed persistent wage stagnation and even indicated a slowdown in job growth this year from the pace set in 2014

http://www.epi.org/blog/what-to-watch-on-jobs-day-looking-for-a-pickup-in-job-growth-signs-of-wage-growth-and-a-glimpse-at-the-future-for-the-graduating-class-of-2015/



Online Assignment Part 2

3242

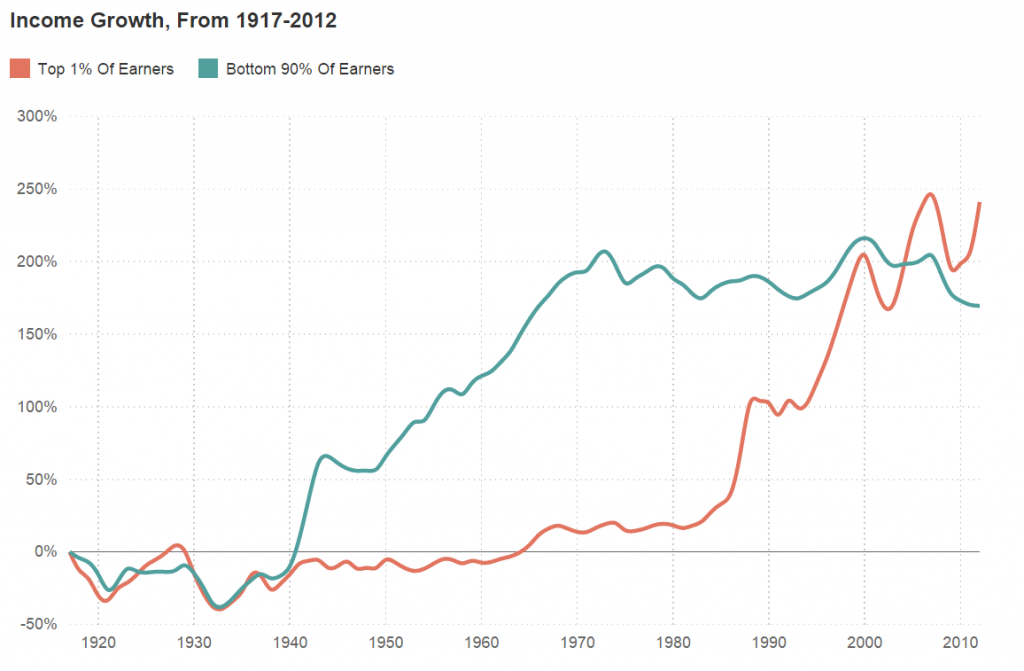
Description: This graph depicts income growth from 1917 to 2012. The author made sure to correlate his information with the chart above. By having his information correspond to the graph, the reader is then better able to understand the multiple trends in the graph above. Notably, an interesting trend can be seen from the graph above, from 1980 to 2010 income growth for the top 1 percent dramatically increased. On the other hand, from 1980 to 2010 income growth for the 90 percent has disturbingly stagnated.

Summary: In the article, “The Fall And Rise of U.S. Inequality, In 2 graphs,” Quoctrung Bui, the author, goes into detail about inequality in the United States. According to the author, a phase called the great compression was a time when incomes rose for the bottom 90 percent. On the other hand, also during the great compression, the 1 percent of earners experienced a stagnant income growth. The author then explained how during these past 35 years “marginal tax rates” fell, resulting in an income rise for the top 1 percent. Notably, also occurring during these past 35 years, the author said, “…a combination of global competition, automation, and declining union membership, among other factors, led to stagnant wages for most workers. “

http://www.npr.org/sections/money/2015/02/11/384988128/the-fall-and-rise-of-u-s-inequality-in-2-graphs

Graph about Unemployment Rate in Minnesota (Second Posting [Hannah Ally])

This article “In unemployment rate, a tale of two Minnesotas” by Bob Collins(MPR news) main focus was to cast an eye and find the cause of unemployment rate and in Minnesota. Over 5,000 jobs were lost and unless you were in health care, trucking, or the hospitality, you weren’t working. Also there are other major contributors to this great feat, which are longevity of unemployment, gender/age, and race. The race factor is mind boggling,people of color especially African Americans are discriminated against because the lack of education and a significant amount of criminal records in contrast to whites. “It adds additional support to a report last month that household income among blacks/African-Americans in Minnesota has plunged from 2013 to 2014. ”

Out of the three graphs that were presented in the article, I chose the graph on Ethnicity/ Selected Race. As you can see, African Americans have the highest unemployment rate, peak about 23% in 2011 with the low 10% in 2014. But you see that rate is rising again this year over 15%. For Hispanics the rate is gradually decreasing this year but the peak was for unemployment was 2010 at about 16%. Finally for Whites the graph shows the rate has roughly been under 5% and this year you can see that both Hispanics and Whites have come to a meeting point for unemployment at about 3% this year.

http://blogs.mprnews.org/newscut/2015/10/in-unemployment-rate-a-tale-of-two-minnesotas/