
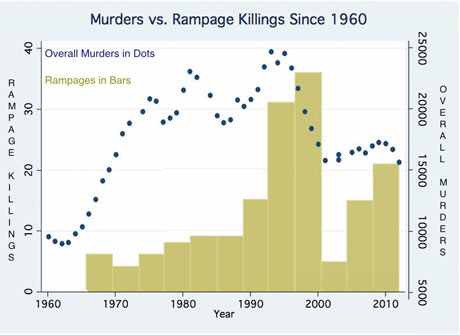
Bar graphs are used to compare the rate of change throughout different points of time. They are also used to show results from different actions that were taken and compare what was accomplished with these acts.
http://www.theguardian.com/commentisfree/2012/jul/21/colorado-shooting-james-holmes-history

