Author Archives: RHONDALISA ROBERTS

MAT 1190 Graph Assignment

Rhondalisa Roberts MAT1190 M&W 2:30pm-3:45pm

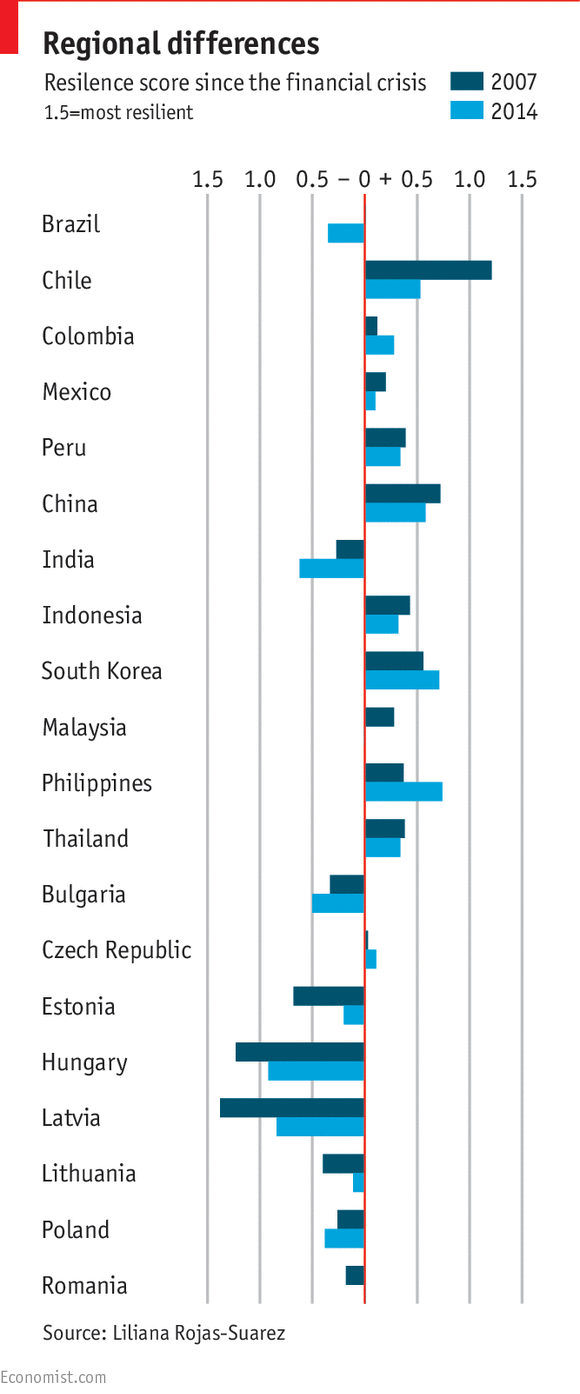
Graphs are an essential means of visualizing information. This graph is very unique because the X values are to the left which are the countries and the Y values are to the top of the graph, which are the numbers. The Y values to the center has zero, then negative values left and positive values to the right.

The information from the TheEconomist.com (http://www.economist.com/blogs/freeexchange/2015/03/emerging-markets)  reflects the ability to these countries being able to cope through the financial crisis and compares two years, 2007 and 2014. Liliana Rojas-Suarez of the Centre for Global Development presented this data to show which countries will be most vulnerable and drastically affected by a global financial crisis.


How my major Hospitality Management relates to Math

Good Afternoon,

My name is Rhondalisa Roberts and I am a Hospitality Management major. Being that the hospitality industry is full of costs that effect the bottom line, there is a lot of math required. The hospitality field uses math in the following ways;

  1. Calculating RevPar which is Revenue Per Available Room (hotels)
  2. Calculating City, State and other taxes (hotels)
  3. Monthly Statements
  4. Accounting Departments perform Night Audits (hotels)
  5. Measurements for cooking (restaurants)
  6. Human Resources wages and salaries
  7. Inventory purposes
  8. Critical Thinking

There are several ways to use math in our field and I have only listed a few. Any business needs math to calculate and perform daily operations.

Rhondalisa Roberts

MAT 1190