-
Recent Posts
Recent Comments
Archives
Categories
Meta
Assignment 2: Bar Graph
This entry was posted in Uncategorized. Bookmark the permalink.
Our goal is to make the OpenLab accessible for all users.
Our goal is to make the OpenLab accessible for all users.


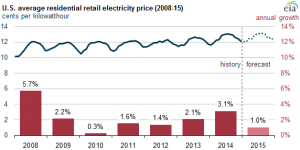
It’s great that you found the graph. However, how was it being used in the context of the article? More importantly, what phenomena can YOU identify in the graph. To me what stands out is the juxtaposition of a bar graph and a general time-series graph. Why was this done? In particular, why was the bar graph chosen for the annual growth data?