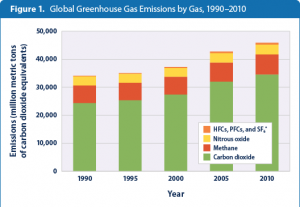
This graph shows how much of greenhouse gas was occurred through 1990- 2010.
-
Recent Posts
Recent Comments
Archives
Categories
Meta
Our goal is to make the OpenLab accessible for all users.
Our goal is to make the OpenLab accessible for all users.

