Problem #(12), By Anil K. Dipu
The number of major earthquakes in a year is approximately normally distributed with a mean of 20.8 and a standard deviation of 4.5
a) Find the probability that in a given year there will be less than 21 earthquakes.
b) Find the probability that in a given year there will be between 18 and 23 earthquakes.
Step 1. Part (a) List all the given facts for the first statement.
Given:
The statement says that the situation is approximately normally distributed for the number of earthquakes in a year.
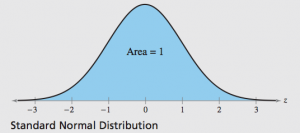
This simply means that we can use the “Standard Normal Distribution Curve” for µ=0 and make it equal to the mean that it gives us to use from the statement which is 20.8 as the new µ (“Miu”-mean). Thus the curve is balanced on both sides. (see example below)
The mean is now 20.8, (µ=20.8).
The standard deviation sigma, is equal to 4.5 (σ=4.5) which we will use to find the Probability with the mean (µ=20.8)
Step 2. Analyze problem (a). And draw a standard Normal distribution curve. And label the µ and X.
In both a and b, we do not have an exact sample of population “n”, or success “p” so we do not have to use the subtraction or addition of 0.5.
Therefore we can use the normal method to find the probability with the Z score from the Standard distribution Table which only gives the probability as an area to the left of Z and X.
“Z” represents a result for a part of “1” under the normal standard distribution curve.
The “X” is a piece of data that relates to an area or fraction under the curve. It belongs to entire data series that can be near or away from the mean (µ). Though X is not area, it is a continuous a number.
For problem a, the probability must be less than the X of 2. Therefore X can be understood as less than 21
(X= less than 21). The probability is not X and it is not 21. It is an area under the curve which is less than 21.
To find the area that of X= less than 21 we draw a standard distribution curve and label the Miu which is 20.8 as the middle or center of the data. We mark where x is located.
As you will see, 21 is a bit further on the right side of (µ=20.8), but we need an area that is less than 21.
Since we are using a table which shows areas to the left of Z and X we have to shade or mark the area that is less than 21. The area will be on the left.
This also means that we Do Not have to subtract the final value of area from 1 since the area that is already on the left is less than the X of 21.
Step 3. Find Z and Area for probability.
We now use the regular method to find Z in order to find the value of Probability as an area which means a X=probability is less than 21.
Z= (X- µ)/ σ = (21-20.8)/ 4.5= 0.2/4.5 = 0.0444444444444444 =0.4
(round to the nearest two decimal places after the “point or period” for z since the table uses a few decimals)
(A positive, “+” number will mean that is an area of Z which is greater than the Miu for 20.8).
Step 4. Find value of Probability with the Z score
The table that we are going to use is Table 4. We can see that 0.04 of z is an area of .5160 (=.516) which is understood as a Probability less than 21 which also on the left under the curve for normal and standard distribution.
Step 5. Part (b) List all the given facts for the first statement.
Given:
Standard Deviation is σ =4.5 and mean is µ=20.8
X is 18 and 23. The probability is supposed to be between these two data points.
Step 6. Draw the standard distribution table with the Miu and two X’s labeled.
From the standard normal distribution curve we can see that the area is between the two data points for x of 18 and 23. Therefore we need to try find the value of that area.
(Note 1: That part b did not say less than or more than so still do not need to worry about subtracting our final answer from 1, Note 2: Also since the table will always show an area that is to the left for X and Z, we are only looking at areas that concern the middle portion between the two X’s of 18 and 23. With corresponding Z’s)
Step 7. Find the two z scores, with their corresponding areas in order to find the actual difference for area of Probability.
For the first Z we use the first x of 18 and subtract Miu of 20.8, then by standard deviation 4.5.
We will now proceed as follows (18 – 20.8)/4.5 = -.062, with area of 0.2672 for A1
(For a negative value of Z, use Table 1 for area of Z less than Miu)
The second Z is the same but we use 23 for the second X.
The process will be written as (23 – 20.8)/4.5 = .49, with area of 0.6879 for A2
Step 8. Find the probability between the two X’s of 18 and 23.
The method for probability between two values of X will be stated as follows: A2-A1
(The larger Area subtract the smaller Area)
Then we can use the table which corresponds to the new Z to find the Probability of area under the curve.
The new area is calculated by 0.6879 – 0.2676 = 0.4203
Step 9. Review, Study, & Leave A Comment if preferred.
Thankyou,
Anil
million and
million. What is the probability that the profits for the next quarter will lie between $100 million and $150 million?


