Study Guide for Problem #7 on Exam #3 Review Sheet

I’m Laticia Bourne, and I’ll be giving a step by step explanation on how to solve problem #7 on Exam #3’s review sheet, which reads:

The quarterly profits for a large company are normally distributed with  million and million.  What is the probability that the profits for the next quarter will lie between $100 million and $150 million?

Step 1.

The first thing that’s always best to do is pull out the information given.

Mean: 134 million

Standard Deviation: 20 million

In this case, we have two x’s

X = 150

X= 100


Step 2.

Before we can find the probability, we first have to find two z-scores for our two x’s. We do this by using the following equation:

z = x – mean/standard deviation

We’ve already pulled out the information needed for that equation in Step 1, so now to plug those numbers in for each of our x’s:

1. z = 150-134/20

z= 16/20

z = 0.8

2. z = 100-134/20

z= -34/20

z = -1.7


Step 3.

Now that we have our two z-scores, we then use the z-table to look up the area for each one. You should find that the area for the z-score 0.8 is .7881 and the area for the z-score -1.7 is .0446.


Step 4.

The final step to finding the probability to our problem is to now subtract our areas:

.7881.0446.7435

So the answer to our problem is:

The probability that the profits for the next quarter will lie between $100 million and $150 million is .7435.


I hope my explanation was very helpful, good luck on the final everyone! 🙂

Study Guide for Problem #14

Candice Wright

14. One tire manufacturer claims that his tires last an average of 42,000 miles with a standard deviation of 7800 miles. A random sample of 100 of his tires is taken. What is the probability that the average of these 100 tires will last greater than (to the right of) 41,000 miles?

First: We figure out what type of problem the question is and what is the question asking.

This is a sampling means distribution question (the same as day 20’s handout.) We know this because it is stated in the question, underlined above (random sample). The question is asking for the probability of 100 tires greater than 41,000 miles, so this means that our answer has to be between 0 and 1.

Second: We find the mean(µ), n, x-bar, and standard deviation S/σ where the mean/average (µ) stated above is 42000, n is 100, S/σ also stated above is 7800 once we know these numbers we could plug them into the formulas below to solve the problem.   (formulas used included)

Mean (µ) = 42,000

S/σ= 7,800

n = 100

x-bar = 41,000

Formulas Needed 

1. Sampling Distributions: for standard deviation σx-bar: S/√n

2. Sampling Distributions  convert x-bar to z:  z = (x-bar – μ) / σx-bar

*We use the sampling distribution formulas rather than the normal distribution formulas because we are working with samples.

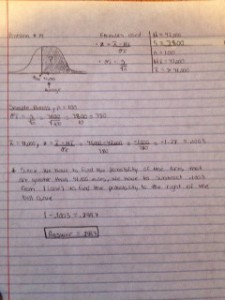
 Third: Construct the Bell curve and map out which side of the curve we are finding the probability for. (see inserted picture). We have to find the probability to the RIGHT of the bell curve so we have to subtract 1 (one) from the x’s Z score. Why? Because the table only gives us the Z score to the left not the right.

Solving the problem

Step 1: We find the standard deviation for x-bar first because this answer is used as the denominator for the following step.

σx-bar = S/√n=  7800/√100 = 7800/10 = 780

Step 2: we use the sampling distribution formula for x-bar to convert our x to z.

z = (x-bar – μ) / σx-bar = 41000-42000/780 =(41000-42000=-1000) -1000/780=  -1.28 (round answer to nearest two decimals)

*Note: we round the answer to the nearest two decimal places because we are finding the Z score and we only need two decimal places.

Step 3: We look up the Z score in the table

-1.28 –> .1003

 Step 4: .1003 would have been our answer if we were finding x to the left of the bell curve. In this case we have an extra step and that is to find x to the right of the bell curve. There are two ways in finding the Z score to the right of a bell curve.

1. Take the Z score and switch the sign. (it will either be positive of negative so the opposite sign of whatever your Z score is)

-1.28 –>1.28

Then we will just look up the Z score in the table and find our answer (x).

1.28 –> .8997

2.  Or you look up the Z score in the table to find your X and then subtract that number from 1 (one) and that would be the answer.

-1.28 –> .1003       1 – .1003 = .8997

*Moral of the story, whichever way you feel comfortable using, you will get the same answer.

Step 5: Check back to see what the problem was asking and see if we answered it. In this case we did, so the problem is now complete.

Answer: .8997


Study Guide for Problem # 22

Hi my name is Zinaida Ashurova i’ll be explaining Study Guide for Problem # 22

The marks on a statistics exam are normally distributed with mean 70 and standard deviation 10

  • Looking at this problem first you should notice that it asks you for statistics exam grade being

Normally distributed” That means that the graph of a normal distribution will be normal Bell Curve.

  • This problem gives a Mean and Standard Deviation

Mean gives the location of the line of symmetry (in the middle on the bell curve) and standard deviation describes how much the data is spread out

In this problem we know that:

Mean (µ) =70 SD=10

The Formula we need to use in this problem is Normal Distribution formula Z=X-M/Q

A) What proportion of students will receive more than 80?

X=80, M=70, Q=10   80 -70/10= -1 Z= 1 After we find Z “1.000” we need to find its Area in Standard normal Distribution Table; you will find that 1=.8413 You can see that X=80 is > than our mean 70 and is located on the right side of our Bell Curve – which means we have to subtract 1 from our Z score area

1 – .8413=.1587 Our Final Answer

B) Find the probability that a mark will be between 60 and 90

We can see that our two X’s are 60 and 90 therefore we have to apply both numbers separately to our Normal Distribution Formula.

60–70/10= -1

90-70/10=2

Now that we found Z scores for both our X’s we have to look them up in Standard normal Distribution table for its Area’s

-1=.1587

2=.9772

To find the probability in between of 60 and 90 we have to subtract bigger Z score from Smaller

.9772-.1587=.8185 Our Final Answer

C) If less than 60 is a failing grade, what is probability that a student fails the class

60–70/10= -1

Now that we found the Z score for our X we have to look it up in Standard normal Distribution table to find its Area

-1=.1587 Our Final Answer

D) If only the best 10% of the grade in the class will receive A, what grade must a student obtain in order to get an A?

10%=.10 From the problem they ask if only the “BEST” from the class will receive A, we can assume that its more than our M=70 which will be located to the right of our Bell Curve

Because it’s on the right we automatically subtract 1 from .10

1-.10=.9 Find the Z value using the in Standard normal Distribution table

The closest value to .9 is .8997 Therefore Z=1.28

Now we have to convert z to x using Normal Distribution formula”

X=M+ZQ

1.28*10=12.8+70=82.8 Our Final Answer

Study Guide for Problem # 23

Image

Hi, my name is Fatima Elmachatt,

I will be explaining how to do the problem number 23, here is the question:

A multiple-choice exam has 8 questions, and each question has 3 possible answers.If you guess the answer to each question and don’t leave any blank, what is the probability you get exactly 4 answers correct?

First: when am I am reading the problem I make sure that I read several times , to get what the question is really about and what kind of formula to use in order to solve it, so the key words for the problem are the ones I have highlighted , that reminds me of the:

 Binominal Formula: The Probability of getting exactly X success in a binominal experiment with trials is:

P(x)= nCx P^x q^n-x

In This case there are two possibility either I am going to guess the correct answer or the wrong one ,

Second: The probability of getting correct answer is 1/3 and the the probability of getting wrong answer is 2/3. (we have 3 possible answers)

Because when we give the right answer there is only one correct, when we pick other than the correct one, so there are 2 wrong ones, in this example.

Third: Now we can use our formula :

So here we are looking for the probability of getting exactly 4 answers correct, which the P(x).

The n is the number of the questions which is 8 questions.

The p is the probability of getting of getting one answer correct is (1/3)^4 , we are using the power 4 , because we want exactly 4 correct answers

The q letter corresponds to the wrong answer which is 1-1/3= (2/3) ^8-4

P(4)= 8C4*(1/3)^4*(2/3)^8-4

=70*0.012345679*0.197530864

  P(4) = 0.170705684

I hope that I explained the problem clear enough. Please don’t hesitate to ask for more details or further explanation, I will more than happy to help.


Final Review, Study Guide, Problem 2

Final Exam Review
Problem #2
Julieann McGonigle

2)  There are six photocopying machines in a college office. During August 1999, these    machines produced 2567, 5456, 3769,2245, 6678, and 3398 copies. Find the mean, median, and mode of the number of copies produced by these machines.


Step 1: List data in order starting with the least amount of machines produced & ending with the greatest amount of machines produced:

2,245               2,567               3,398               3,769               5,456               6,678

Step 2: After listing them in order, you then add all of the numbers together:  When you have the sum of all the numbers, you divide by the amount of numbers, in this case 6, to calculate the mean.

2,245
2,567
3,398                         24,122   = 4,018.83(MEAN)
3,769                              6
5,456
+6,678
24,122

                                               
Step3: in order to find the median, we need to see exactly which number lies in the middle of all of our data. In this case, there isn’t just one number. We now have to add both numbers that are in the middle. After we have the sum, we then divide this number by 2.

3,398 + 3,769 = 7,167   = 3,583.5(MEDIAN)
                               2

Step 4: To calculate the mode, we need to review our data and see exactly which number reoccurs. If there is no number that repeats, then there is not a mode.

  • In this set of data, there is no mode.

Study Guide for Problem # 3

Tanzima Mursalin

I will be explaining problem # 3

3) In a recent contest, the mean score was 210, and the standard deviation was 25.

a) Find the z score of John who scored 190

b) Find the z score of Bill who scored 270.

c) If Mary had a z score of 1.25, what was Mary’s score?

Step 1: First list all the information thats given: Mean or Mu   = 210 & Standard Deviation or theta  = 25

Solving part (a)

To find the z score we have to use a formula which is

 X = 190, which is John’s score.

Next step is to plug in all the values and solve for z.

Z = 190 – 210/ 25    Ans: – 0.8

Solving part (b)

For part b, we have to follow the same exact steps as part a.

X = 270, which is Bill’s score.

Z = 270 – 210/ 25    Ans: 2.4

Solving part (c)

In part (c) the z score is given and we have to find the score. to find the score the formula we have to use is X = µ + zӨ

Mary’s z score is 1.25 and to find her score you have to solve for x.

x = 210 + (1.25)(25)    Ans: 241.25


Study Guide for problem #11

Craig Shaw

#11=New York State has found that 30% of all consumer complaints are valid. If the State received 6000 complaints last year, about how many of them are expected to be valid? (i.e. find the mean). Find the standard deviation.

Step 1: The first thing you want to do is to find n,p,q. n and p are given in the problem where n is the sample population and p is the probability. you find q by subtracting 1 (represents 100-%) from .3.

n=6000          p= 30%  or  .3        q=1-.3=70%   or  .7

Step 2: Now you can find the mean by using this formula-

mew=n * p

6000 * .3=1800 (valid complaints)

Step 3: Finally we can find the standard deviation by using the formula below.

S.D= (SquareRoot of) n * p * q

(SqRt of ) 6000 * .3 * .7

(SqRt of) 1260

S.D=35.5

Study Guide for Problem #8 Exam 3 review

Jacky Xu

8. The finishing times for a long-distance race are normally distributed, with an average finishing time of 3.25 hours and a standard deviation of 0.5 hours. If bob is running this race, what time does he need to finish in order to beat 75% of the other participants?

Step 1: You first have to write down the variables that is mentioned in the problem.
Mean: 3.25
Standard Deviation: 0.5

Step 2: Since you are trying to find how much time is needed to beat 75% of the other participants, you have to find the right side of the graph rather then the left side, which makes it so you have to find the closest Z-score in the Standard Normal Distribution chart for 25% because he needs to be on the other 25% to beat the other 75%, which makes it so you have to find 0.25 in the chart.
Z-score: -0.67

Step 3: After finding the Z-score, you can plug in the numbers by using the formula to convert Z to X by doing x = µ + z(σ) which then turns out to be X = 3.25 + -0.67(0.5)
X = 3.25 + -.335
X = 2.915

Step 4: The number you turn out with is X = 2.915, which means that the amount of time Bob needs to finish the race beating 75% of the people is 2.915.


Problem Number 3

3.) In a recent contest, the mean score was 210 and the standard deviation was 25.

A.) Find the Z score of john who scored 190.

In order to find the Z score, we use the Z formula that we learned in class:

Z equals X minus mu (mu is the same as the mean) divided by standard deviation.

We are given a mean score of 210 and a standard deviation of 25 in number 3.

In A we are given our X which is 190. Our X represents John’s score.

We plug the numbers in and solve: 190-210/25=-0.8     —-> remember always follow PEMDAS (parenthesis, exponent, multiplication, division, addition and subtraction.) We subtract 190 -210 first and then divide by 25.


B.) Find the Z score of Bill who scored 270.

Again we are asked to find the Z score. We follow the same formula used in 3a.

Z equals X minus mu divided by standard deviation.

Here our mean and standard deviation are the same but our X is different.

Our mean (which is given) is 210 and our standard deviation (also given) is 25

Our X was Bill’s score which was 270.

Now we plug our numbers into the formula:

270-210/25=2.4

Here PEMDAS should also be used which means we subtract before we divide.


C.) If Mary had a Z-score of 1.25, what was Mary’s score.

Here unlike A and B, we are given Mary’s Z score and are asked to find her X.

In this case, we use the X formula:

X equals mu plus Z times standard deviation

Z=1.25

mu=210 (given in original problem)

Standard Deviation=25 (also given in original problem)

When we plug the numbers is we get:

210+1.25(25)=241.25

*Here it is important to do PEMDAS as well. First we multiply 1.25(25) and get 31.25 and then we add 210 and get a final answer of 241.25

*I had to write out the formulas because there is no mu symbol nor is there a standard deviation symbol on the computer so here is a picture of the work!

Hope this helped 🙂


Study Guide – Problem #9

Jonathan likes to play soccer. Assume y=number of goals that Jonathan has scored during the fall season and assume y can only take values from 0 to 4. The following table represents the probability distribution for the discrete random variable y.

When given this sort of problem we usually start with the two first rows which are x and p(x) (In this case we are using a y instead of x)

The first row Y has the numbers 0,1,2,3,and 4.

The second row P(Y) is given as 0.11, 0.28, 0.29, 0.15, and 0.17

We then have to create the last three rows which are always in the following order as Y*P*Y, then Y2, and lastly Y2*P*Y

The third row Y*P*Y is basically the first two rows multiplied together 0*0.11=0 , 1*0.28=0.28, 2*0.29=0.58 and so on.

The fourth row Y2 is simply squaring the first row which gives us 0,1,4, 9 and 16

The last row is the Y2 row multiplied with the original P(Y) row. 0*0.11=0, 1*0.28=0.28, 4*0.29= 1.16, 9*0.15=1.35 and so on. ( this is the part where one should be careful to multiply the original P(Y) with the Y2 and not Y*P*Y because all the rows are close together. This is a mistake that can be easily made so its always a good idea to double check your work quickly before continuing with the rest of the problem.)

You can see the finished chart in the picture posted above.

Question A then asks us to find the probability that Jonathan would score exactly 3 goals in the fall season. In the orginal problem under the number 3 that number is blank and we are left to figure that out. The simpliest way to explain that is that the sum of all probabilities must equal 1, since we know this we can take all the given numbers that are listed under P(Y) and add them up which gives us 0.85. When you subtract the sum of 1.00 from 0.85 that gives us 0.15 which you then fill in the blank with to add up to 1.

That answers the question what is the probability that Jonathan scored exactly 3 goals= 0.15

Question B asks the probability that Jonathan would score at least 2 goals in the fall season. We know that when we see the pharse “at least” it means that and more such as “at least 21 meaning 21 or older. In this case we add 0.29+0.15+0.17= 0.61

The answer is Jonathan has a 0.61 probability of scoring at least 2 goals.

Question C is to find the mean of the probability distribution. When you want to find the mean you look at the row Y*P*Y you add up all those probabilities and that gives us a total of 1.99.

Question D we have to find the standard deviation of the probability distribution. When doing this part its actually two quick steps. You look at your last row X2*P*X and add those  up and we get a total of 5.51.

We then use the formula for variance and plug in the standard deviation and the mean squared which is worked out in the picture above:

**Remember to use the order of operations when doing this formula. We square the 1.99 first and then subtract the 5.51 from the 3.901 which gives us 1.5499. We the take the square root of that which gives us 1.245.