-
Recent Posts
Recent Comments
Archives
Categories
Meta
Tag Archives: example
A Timely Study: A Statistical Study of Daylight Saving Time and Crime
Here is a timely story, given that we set our clocks back over the weekend for Daylight Saving Time. NPR had a segment this morning titled “Study Sheds Light on Criminal Activity During Time Change“, about a statistical study by … Continue reading
Example: CDC & WHO Growth Chart (Percentile) Curves
Here is the CDC webpage for their pediatric growth charts that I discussed in class this week: Growth charts consist of a series of percentile curves that illustrate the distribution of selected body measurements in children. Pediatric growth charts have … Continue reading
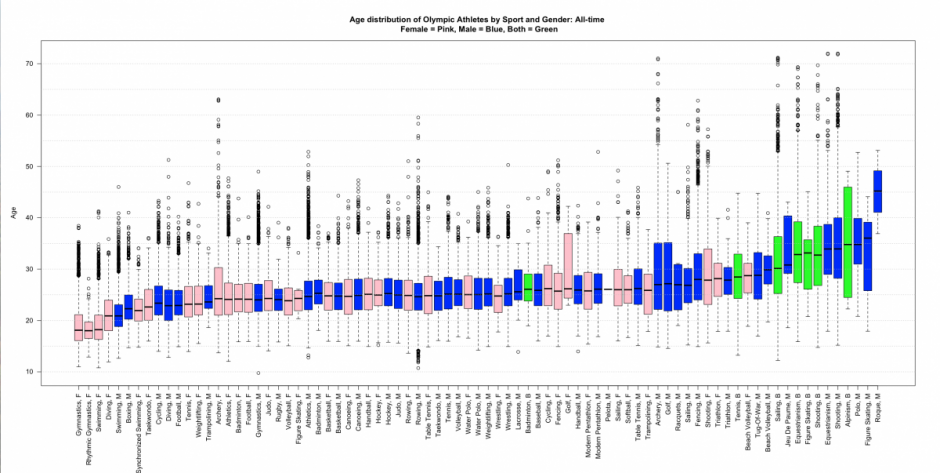
Example: Boxplots of Olympic Athletes’ Age Distributions
We have discussed boxplots as a nice data visualization tool. Here is a good example of how a series of boxplots can be charted side-by-side as a way of comparing a large group of distributions. Via a blog called “Stats … Continue reading
Example: Histograms Showing “The Aging of America”
We discussed frequency distributions and histograms last week, and they will be central concepts in the course. Here are two examples using histograms–both show the age distributions of the US population over time: From the New York Times: “The Aging … Continue reading

