We have discussed boxplots as a nice data visualization tool. Here is a good example of how a series of boxplots can be charted side-by-side as a way of comparing a large group of distributions. Via a blog called “Stats in the Wild“:
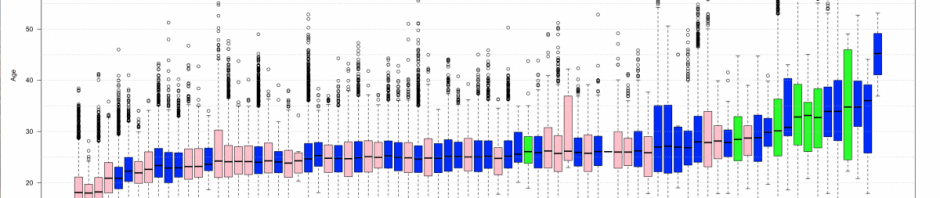
Recently, I saw this pretty cool chart at the Washington Post (I originally saw the chart at this wonderful blog here) about the ages of olympians from the past three olympics. I commented to myself that I thought it would be more interesting with boxplots of the data, rather than simple ranges, and I also wondered what it would look like if we used data from all of the past olympics.
So, I wrote some R code and began scraping sports-reference.com/olympics to get a data set with all of the olympic athletes from all of the games. This took me quite some time (and work kept getting in the way), but I eventually got it right and collected the data.
Here are some of the resulting graphs:
Below is a graph of side-by-size boxplots of age for each sport by gender with blue for male, pink for female, and green for mixed competition. And no the 11 year old female swimmer is not a typo like I originally thought.
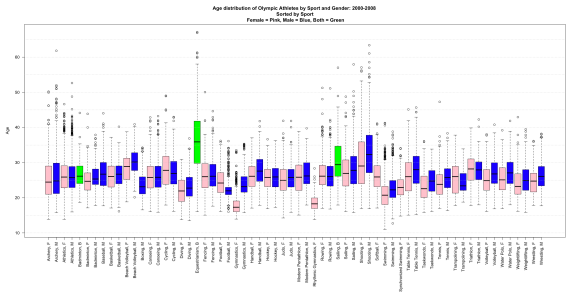
Via http://statsinthewild.com/2012/07/09/olympics-boxplot/
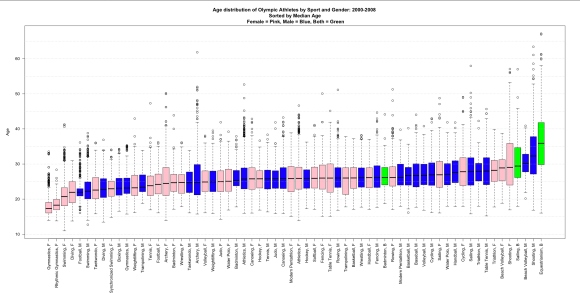
The previous graph was kind of messy, so I’ve sorted this one by median age. Not surprisingly female gymnastics and rhythmic gymnastics have the lowest median ages of competitors while equestrianism has the highest median age of competitor at over 35 years of age.
Click thru to read the entirety of Stats in Wild’s discussion of these and a couple more charts. Also compare with the original Washington Post chart that Stats in the Wild references and was inspired by, which shows only the range of each age distribution (i.e., max and min values), and note how much more information about the distributions the boxplots give you.

