-
Recent Posts
Recent Comments
Archives
Categories
Meta
Category Archives: Uncategorized
A Timely Study: A Statistical Study of Daylight Saving Time and Crime
Here is a timely story, given that we set our clocks back over the weekend for Daylight Saving Time. NPR had a segment this morning titled “Study Sheds Light on Criminal Activity During Time Change“, about a statistical study by … Continue reading
Halloween Probability Humor
Via George Takei–a timely cartoon since we’ll be talking about normal distributions next week!
Book: “Statistics: A Very Short Introduction”
If you’d like to get a more conceptual overview of the topics we’re studying, you could take a look at this book: The nice thing is that you can access an electronic copy of this book via the CUNY library–try … Continue reading
Posted in Uncategorized
Leave a comment
The Combinatorics & Probabilities of Powerball
On the exam last week I asked you to calculate how many different entries there are for the New York Lottery’s Powerball game, given the following instructions from on “How to Play“: Fill in your choice of five numbers from … Continue reading
Example: CDC & WHO Growth Chart (Percentile) Curves
Here is the CDC webpage for their pediatric growth charts that I discussed in class this week: Growth charts consist of a series of percentile curves that illustrate the distribution of selected body measurements in children. Pediatric growth charts have … Continue reading
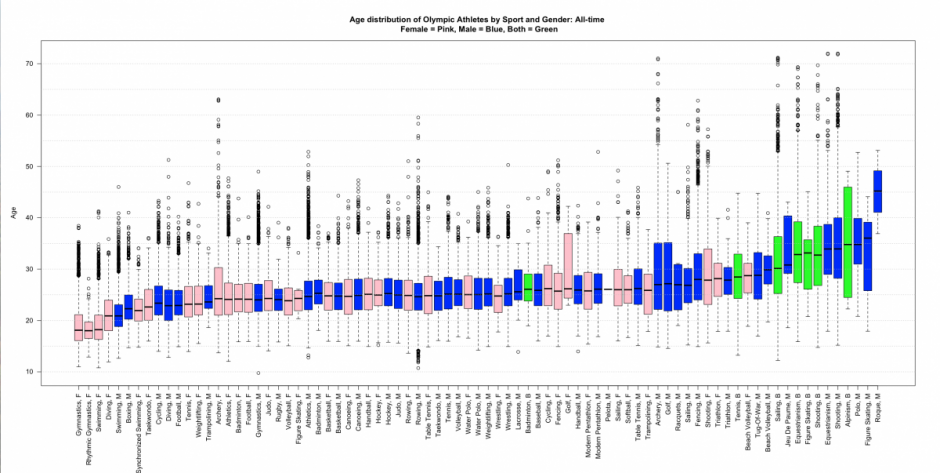
Example: Boxplots of Olympic Athletes’ Age Distributions
We have discussed boxplots as a nice data visualization tool. Here is a good example of how a series of boxplots can be charted side-by-side as a way of comparing a large group of distributions. Via a blog called “Stats … Continue reading
Example: Map of NYC Household Median Income by Census Tract
We’ve discussed the median as a measure of central tendency of a distribution. It’s often used with income data. For example, a headline in the NYTimes a few weeks ago was “Median Income Rises, but Is Still 6% Below Level … Continue reading
Example: Histograms Showing “The Aging of America”
We discussed frequency distributions and histograms last week, and they will be central concepts in the course. Here are two examples using histograms–both show the age distributions of the US population over time: From the New York Times: “The Aging … Continue reading
Welcome to Math 1272/5196: Getting Started with OpenLab
Welcome to the course blog for our section of Math 1272 this semester. The first thing you should do is set up an OpenLab account (see the “Getting Started” instructions) and join the course group.

