Instructor: Suman Ganguli | Fall 2023

Category: Class Agendas (Page 2 of 9)

Class 26 Recap (Mon Dec 4)

Class Info

  • Date: Mon Dec 4
  • Meeting Info: 12p-1:40p, N700

Topics

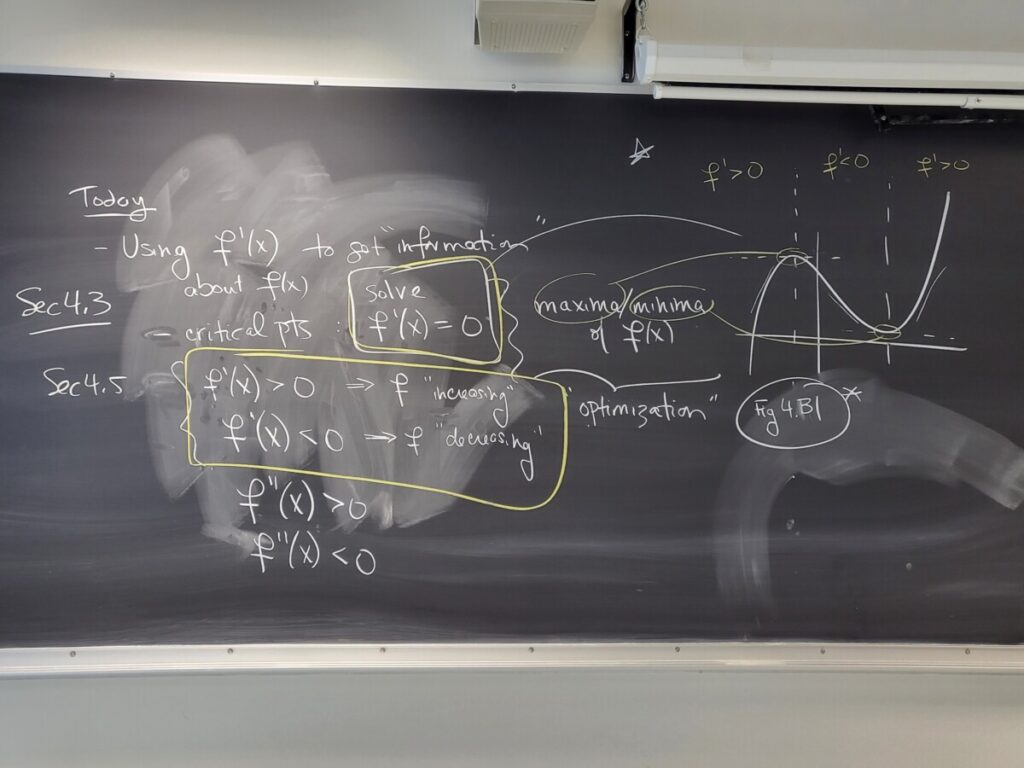
We reviewed how the signs of the 1st and 2nd derivatives give us information about the shape of the graph. This material is covered in Sec 4.3 and Sec 4.5. Please work on the WebWork sets “Application – Monotonicity” and “Application – Shape of Polynomials”, which cover these topics.

See also the previous Class Recap, which includes screenshots from the textbook and some videos on these topics. I also recommended working through #18 from the Final Exam Review sheet:

We outlined some of the exercises in the “Monotonicity” WebWork set, and used the last exercise to illustrate finding the critical point in order to identify the maximum of a function:
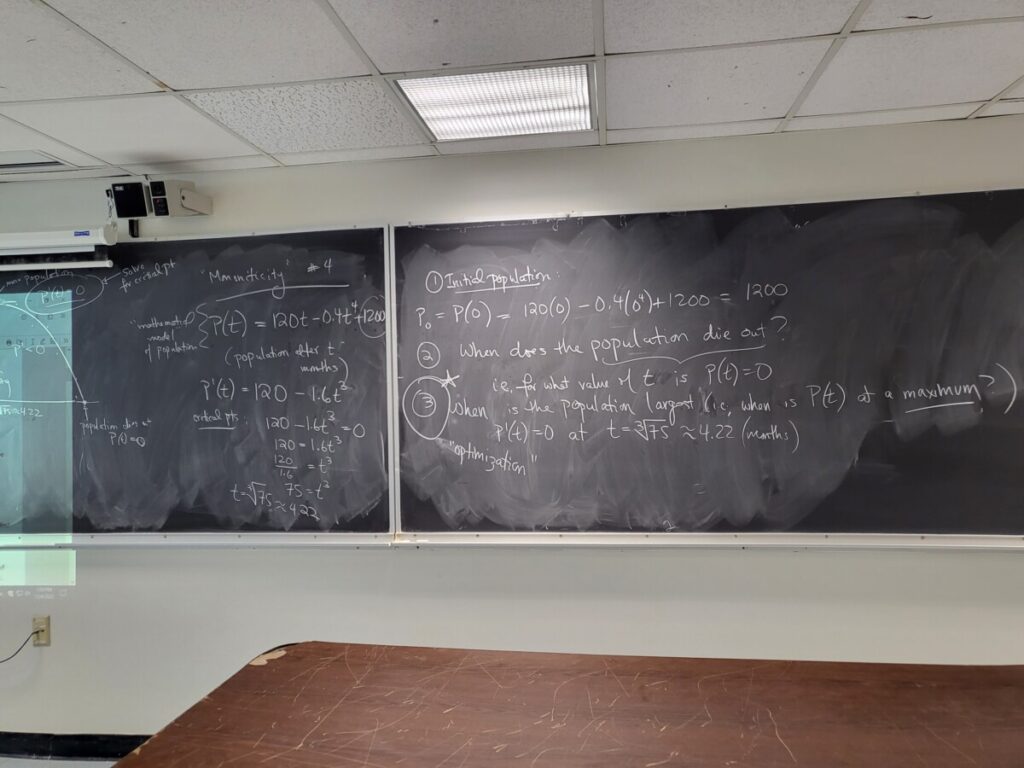
We then did two exercises from the Final Exam Review sheet on “applied optimization” (#9 and #10), which also involves finding the maximum or minimum of a given function by finding its critical point(s). The challenge in these problems is setting up the function from the given information:

You can also study the examples at the beginning of Sec 4.7: Applied Optimization.
Class 25 Recap (Wed Nov 29)

Class Info

  • Date: Wed Nov 29
  • Meeting Info: 12p-1:40p, N700

Topics

We covered finding critical points (i.e., the points where f'(x) = 0), maxima/minima, and using the 1st and 2nd derivatives to figure out the shape of the graph. This material is covered in Sec 4.3 and Sec 4.5.

Please work on the WebWork sets “Application – Monotonicity” and “Application – Shape of Polynomials”, which cover these topics.

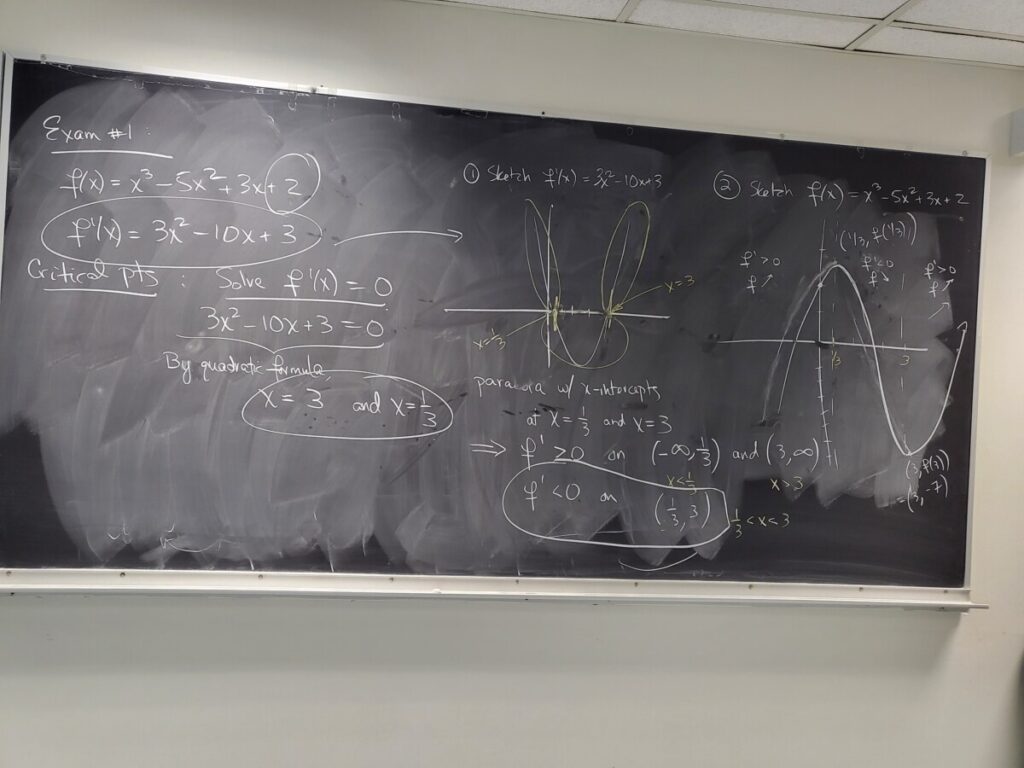
We revisited Exam #1, where you were asked to find the critical points of a cubic function. We now used f'(x) to figure out the intervals on which f(x) is increasing and decreasing. This allowed us to sketch the graph, and also classify the critical points as a maximum (at x = 1/3) and a minimum (at x = 3):

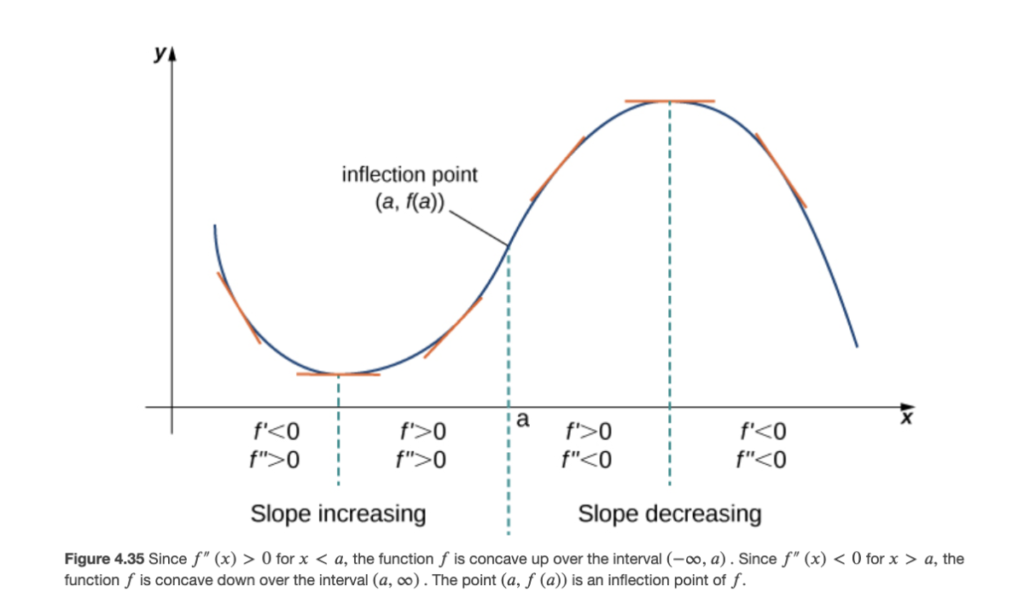
We then studied the additional information about the shape of the graph that the 2nd derivative of f gives us–this is called the “concavity”:

We then applied these ideas about the 2nd derivative to the cubic function from Exam #1:

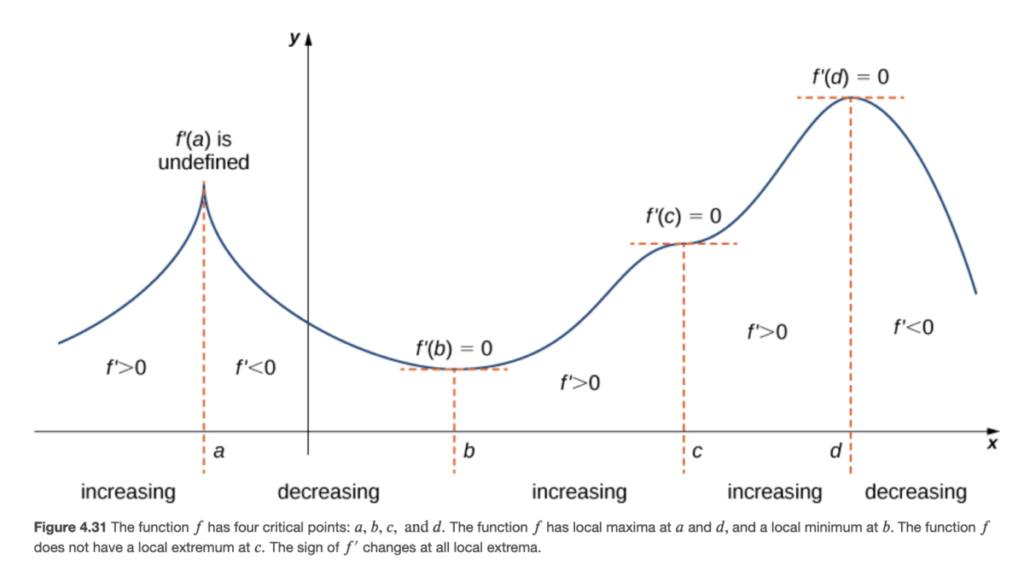
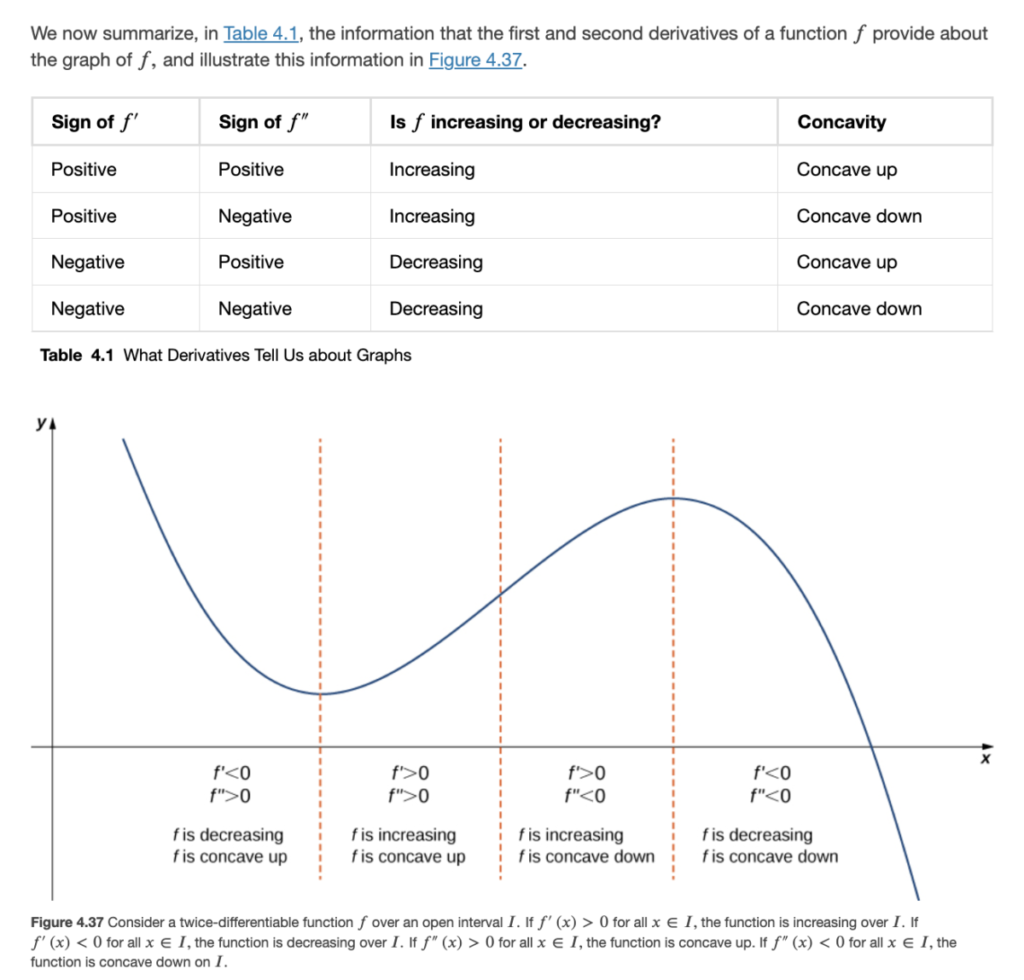
Here are the figures from Sec 4.5 of the textbook that summarize these ideas:

For this, recall that f’ increasing means f” > 0. Thus the two figures in the left column above, for concave up, correspond to f” > 0; and the two figures on the right, for concave down, correspond to f” < 0.

These four “basic shapes” are “glued together” in the following example graph:

Here are a few videos which go through these ideas, with examples:


Class 24 Recap (Mon Nov 27)

Class Info

  • Date: Mon Nov 27
  • Meeting Info: 12p-1:40p, N700

Topics

We went over the exercises from Exam #2, and used these to introduce the remaining topics we will be covering:

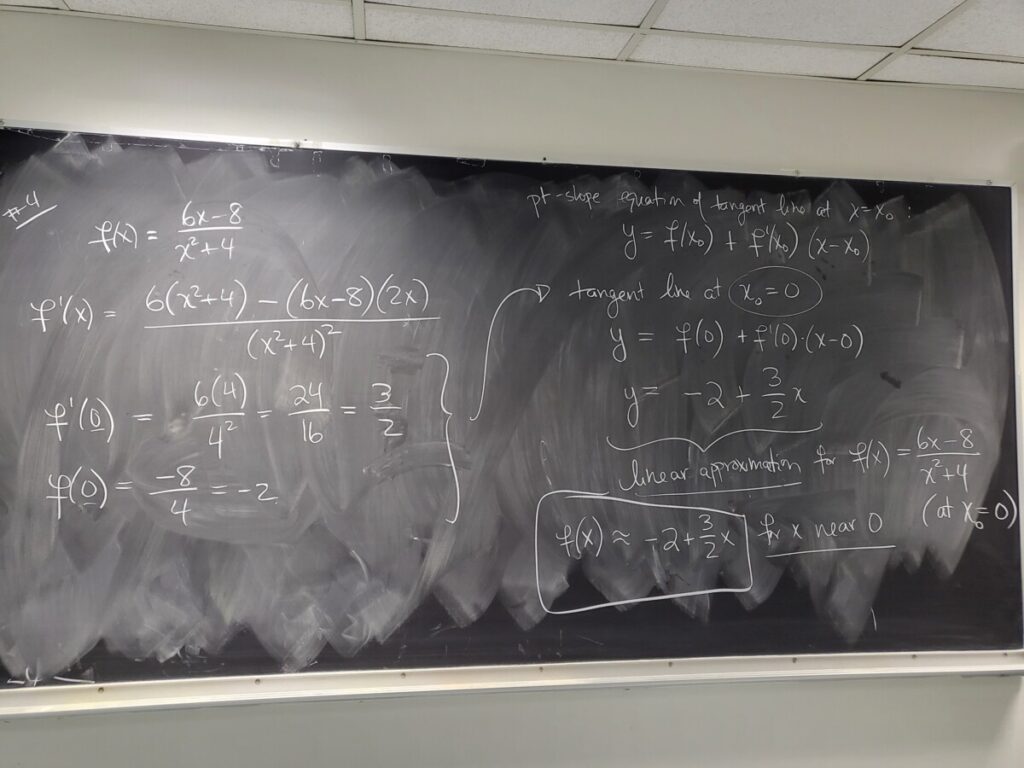
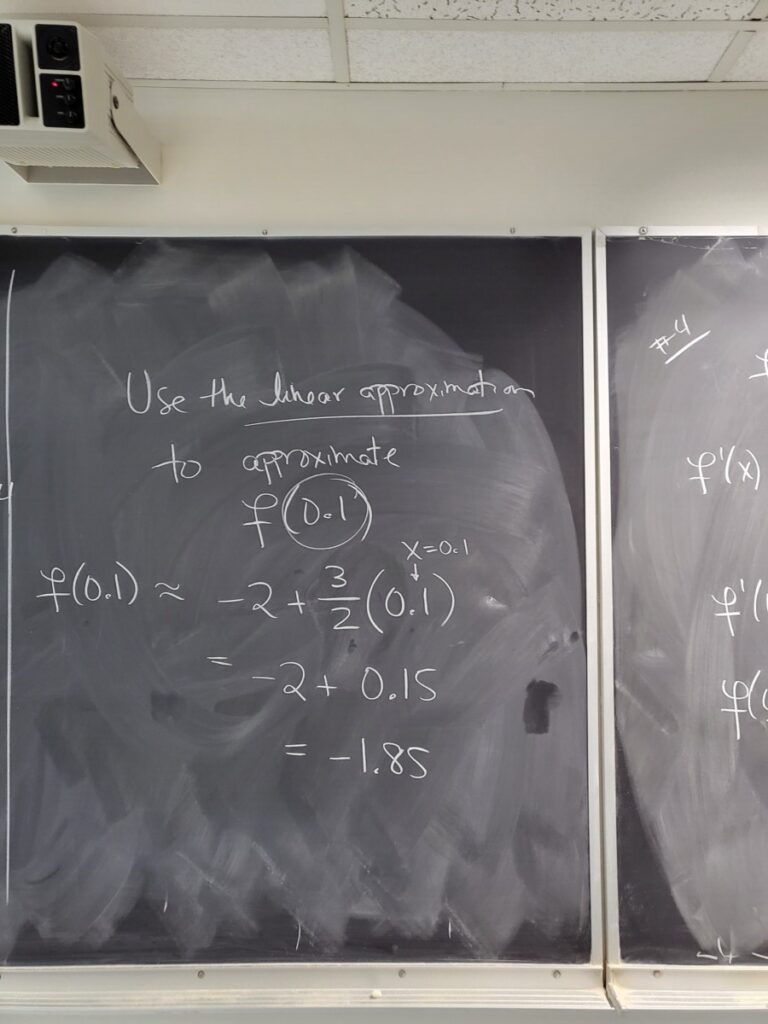
In particular we discussed linear approximation, using #4 on the exam:

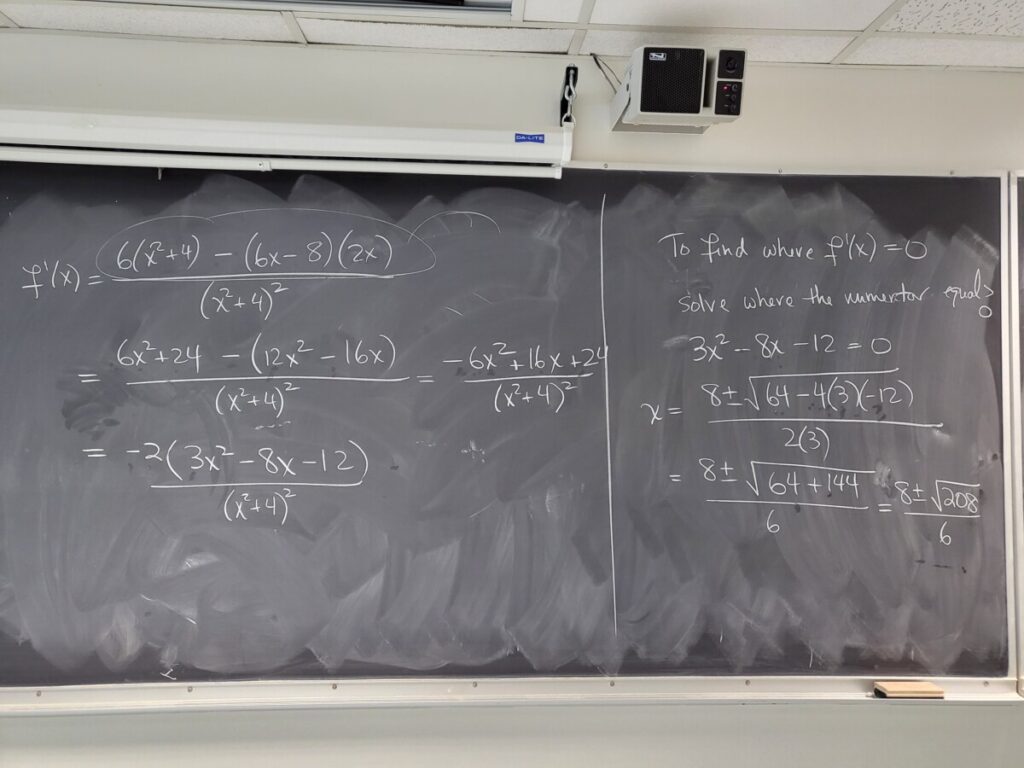
We also started solving for the critical points of the function in #4, i.e., the points where f'(x) = 0:

These critical points, and information about the sign of f(x), will give us information about the shape of the graph y= f(x), and will be needed for finding maxima/minima.

« Older posts Newer posts »