Class Info
- Date: Wed Nov 29
- Meeting Info: 12p-1:40p, N700
Topics
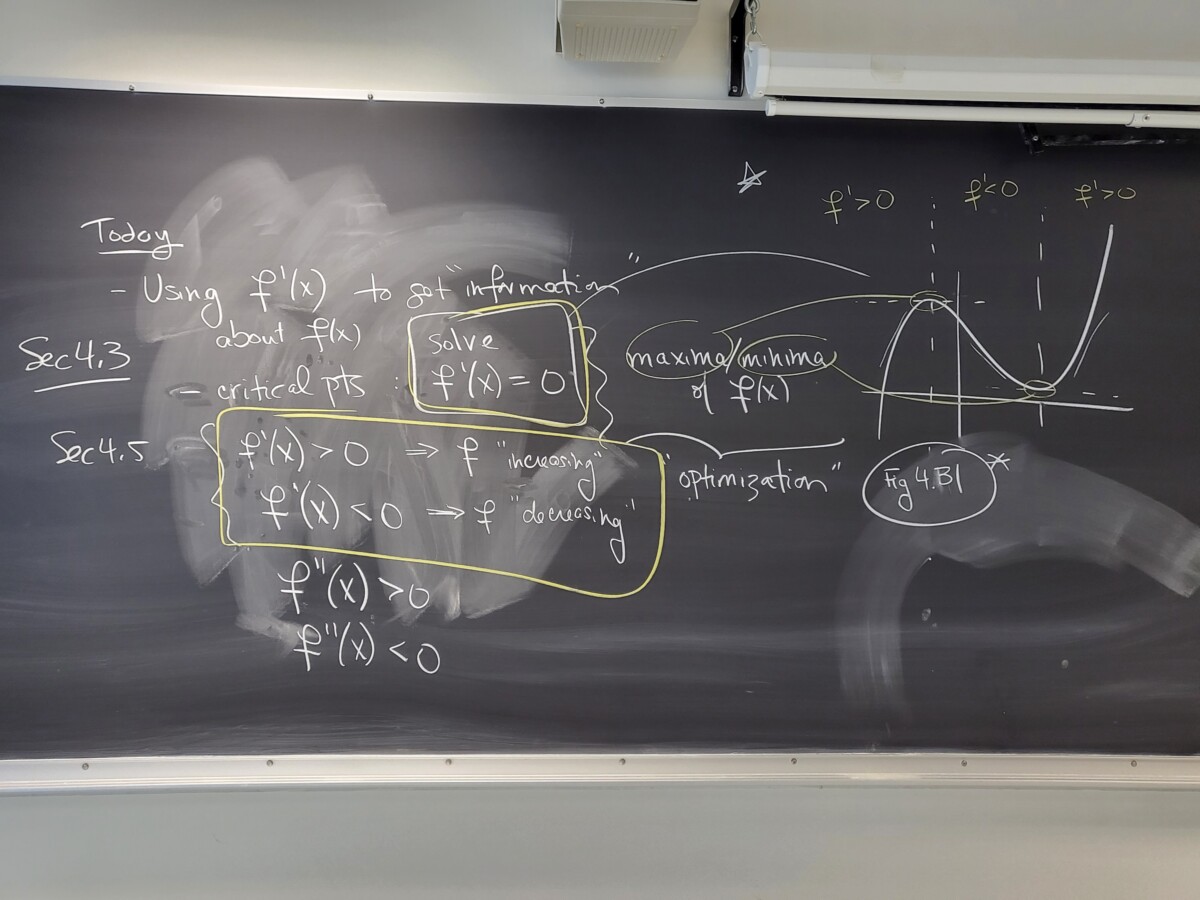
We covered finding critical points (i.e., the points where f'(x) = 0), maxima/minima, and using the 1st and 2nd derivatives to figure out the shape of the graph. This material is covered in Sec 4.3 and Sec 4.5.
Please work on the WebWork sets “Application – Monotonicity” and “Application – Shape of Polynomials”, which cover these topics.
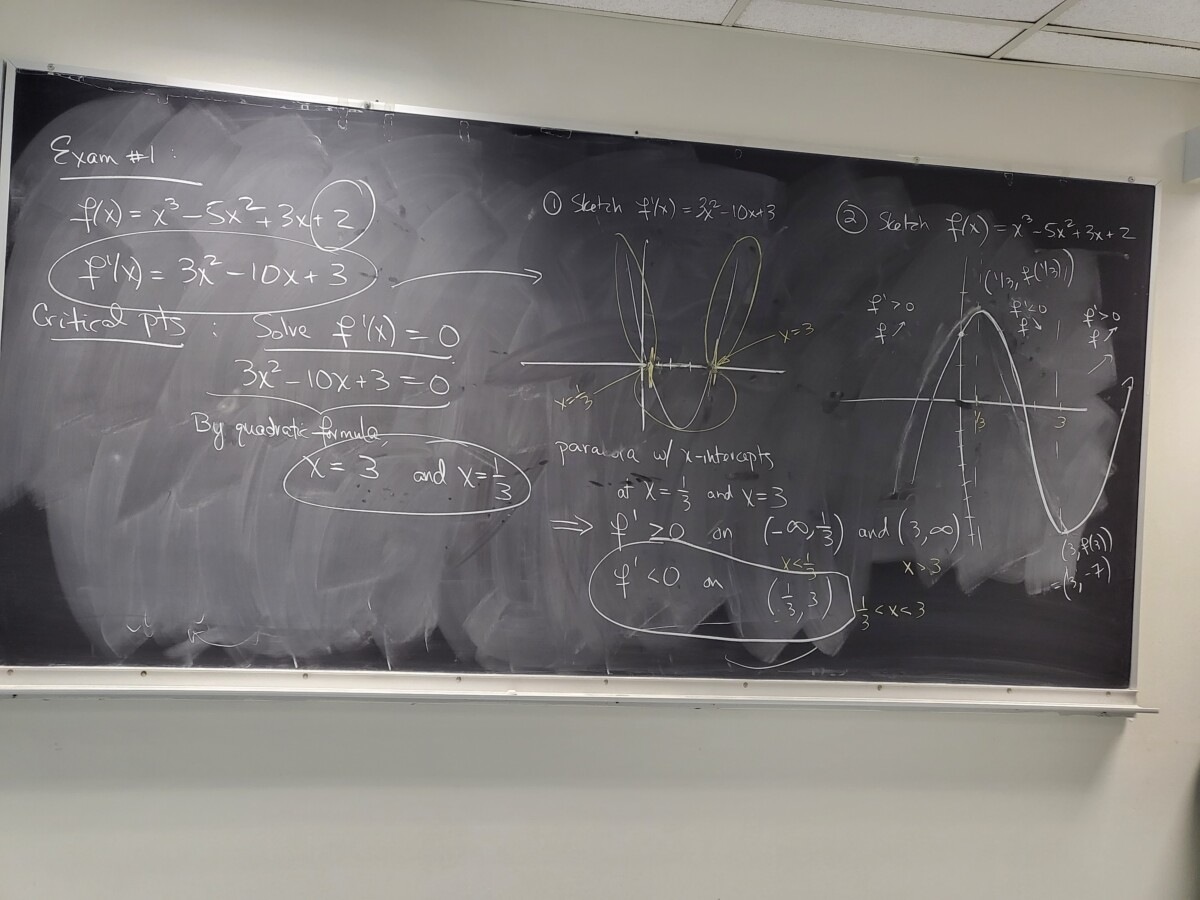
We revisited Exam #1, where you were asked to find the critical points of a cubic function. We now used f'(x) to figure out the intervals on which f(x) is increasing and decreasing. This allowed us to sketch the graph, and also classify the critical points as a maximum (at x = 1/3) and a minimum (at x = 3):
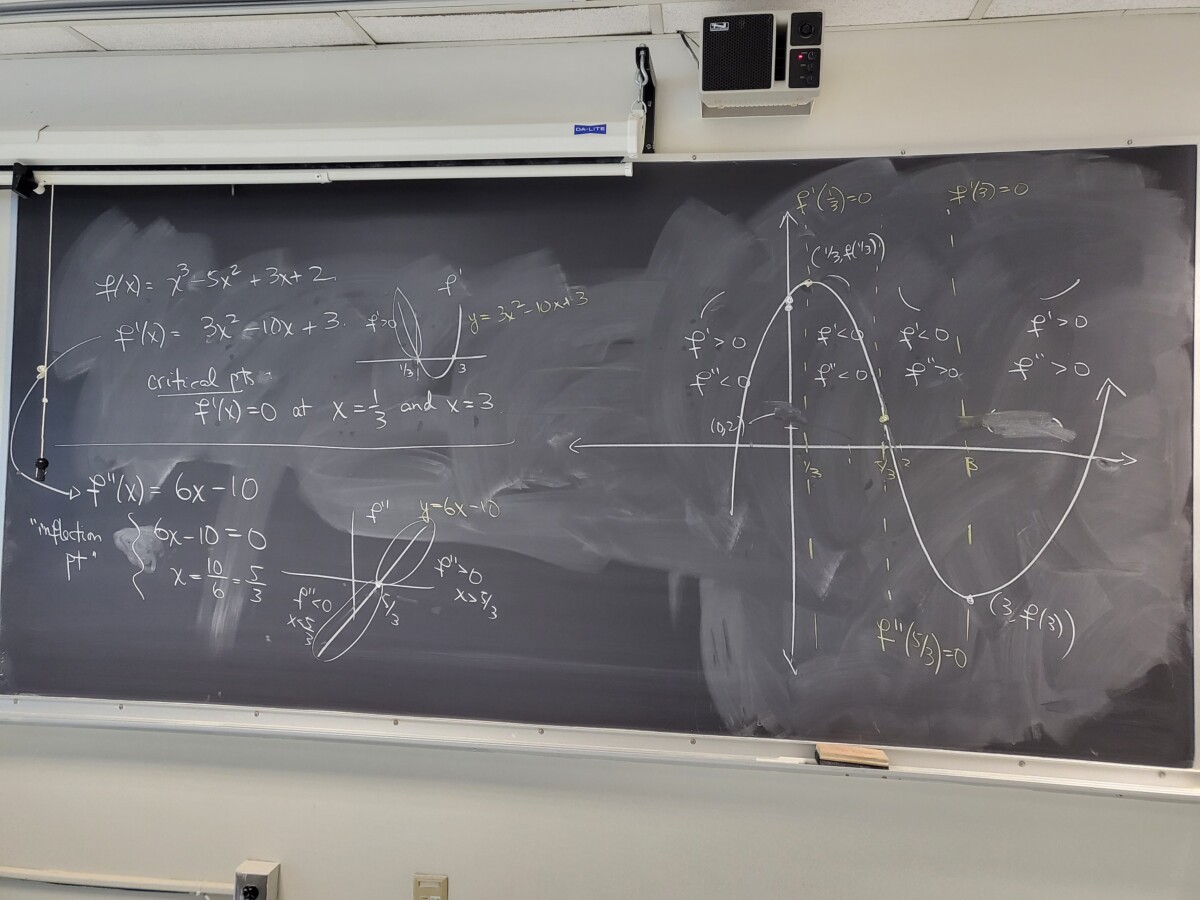
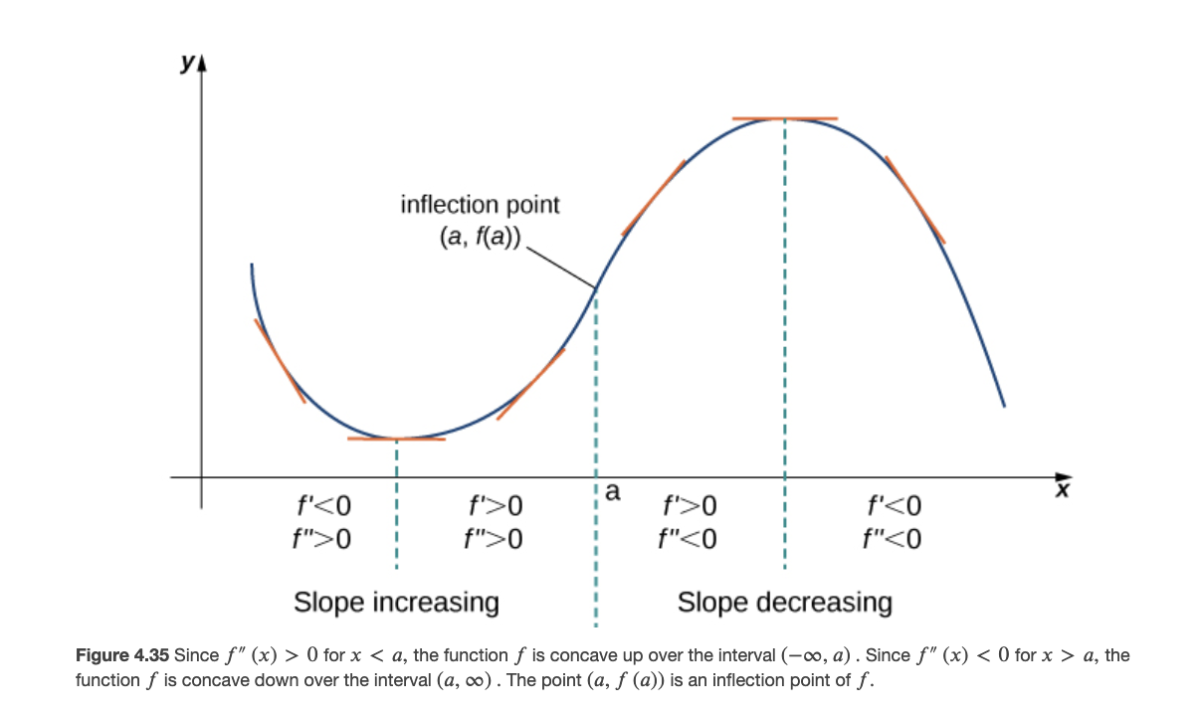
We then studied the additional information about the shape of the graph that the 2nd derivative of f gives us–this is called the “concavity”:

We then applied these ideas about the 2nd derivative to the cubic function from Exam #1:
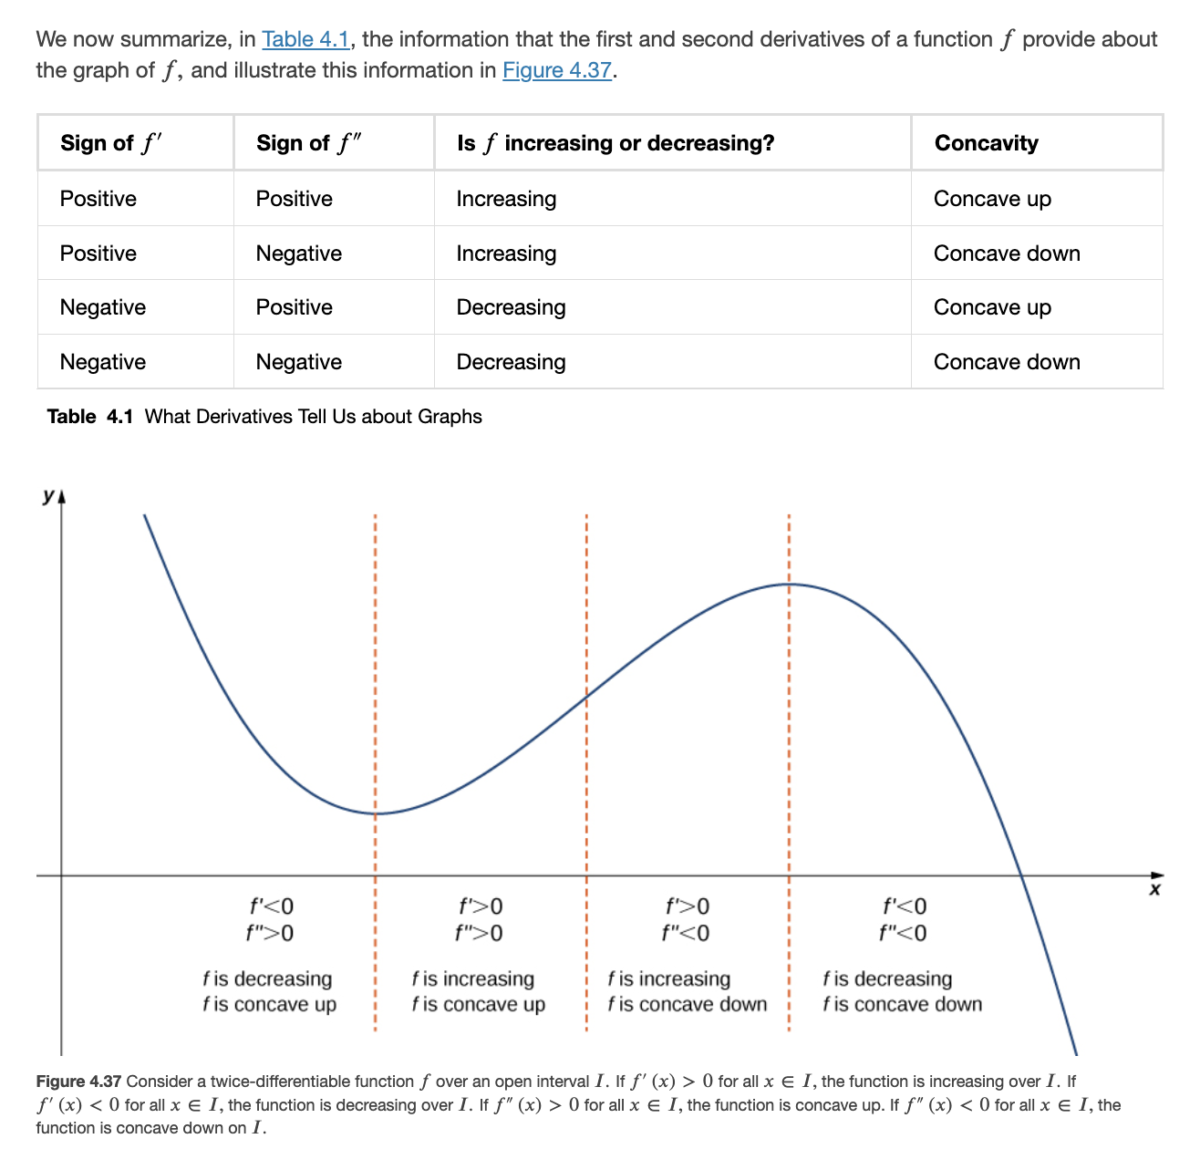
Here are the figures from Sec 4.5 of the textbook that summarize these ideas:
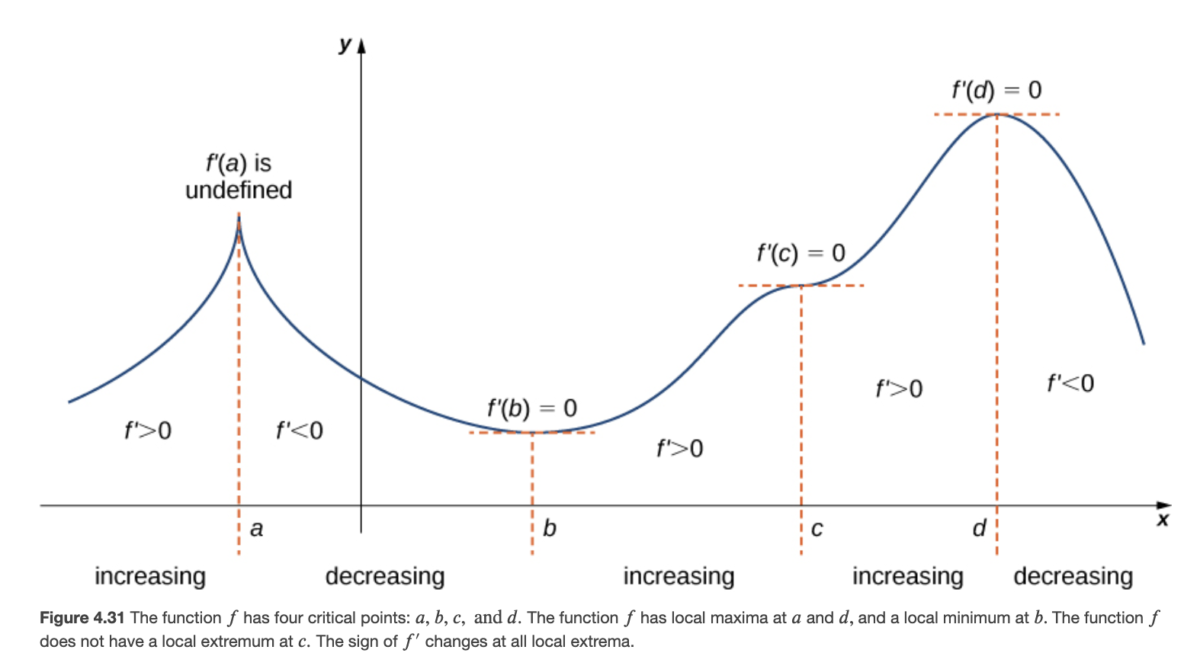
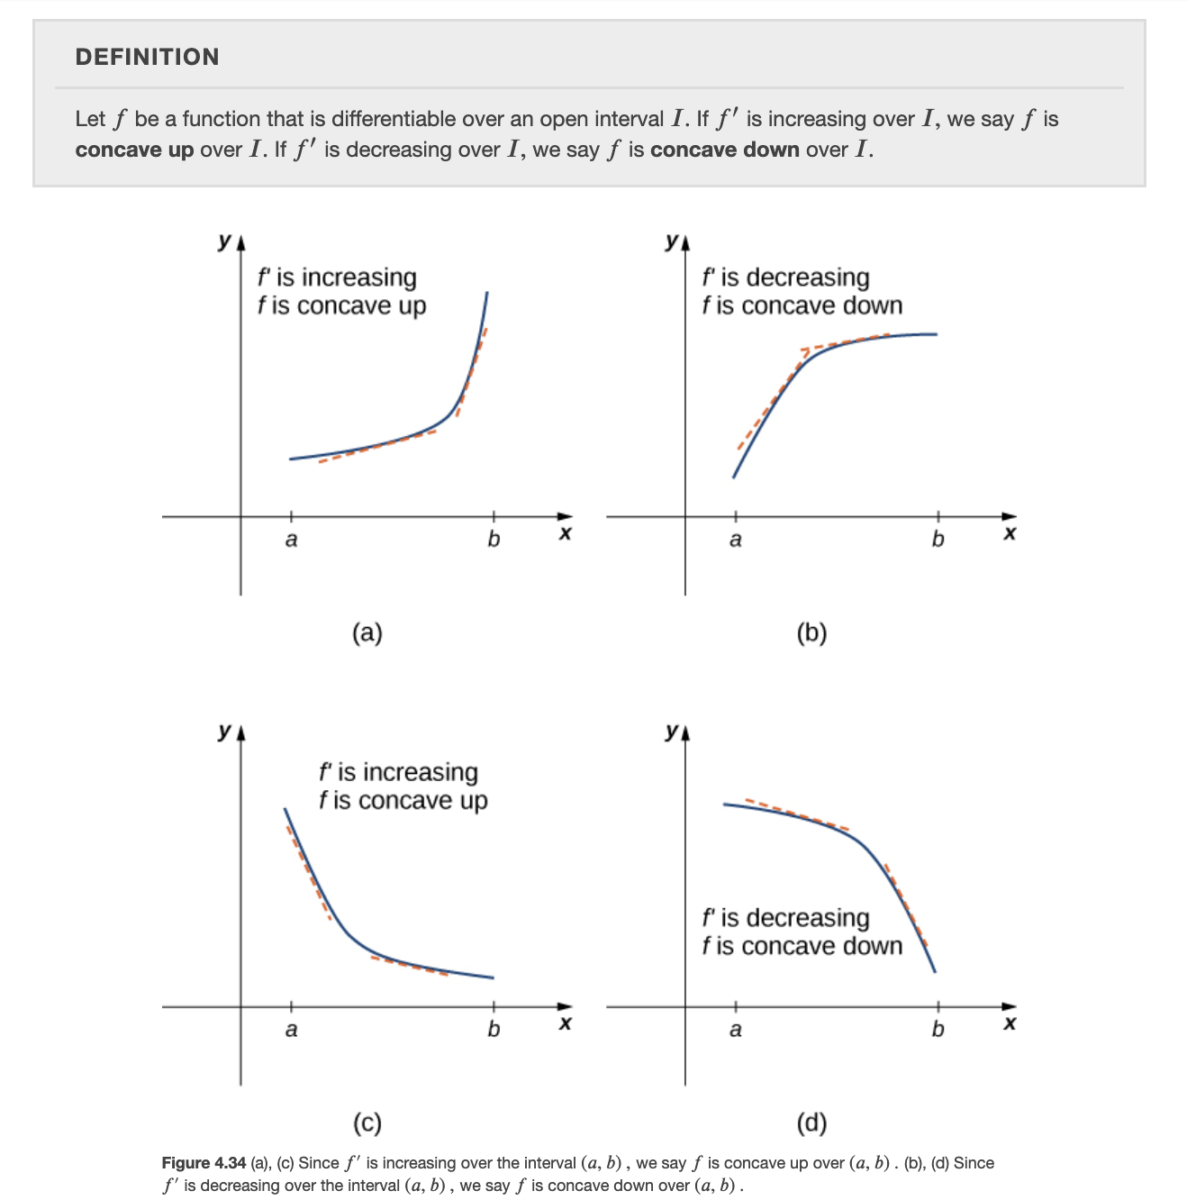
For this, recall that f’ increasing means f” > 0. Thus the two figures in the left column above, for concave up, correspond to f” > 0; and the two figures on the right, for concave down, correspond to f” < 0.
These four “basic shapes” are “glued together” in the following example graph:
Here are a few videos which go through these ideas, with examples:


0 Comments
1 Pingback