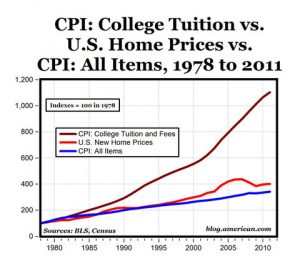
The short article explains the meaning of “education bubble” and provides a suggested reason for it. The graph is used to compare the tuition rate increase with consumer price index and home prices.
MAT1372 Statistics with Probability, FA2018
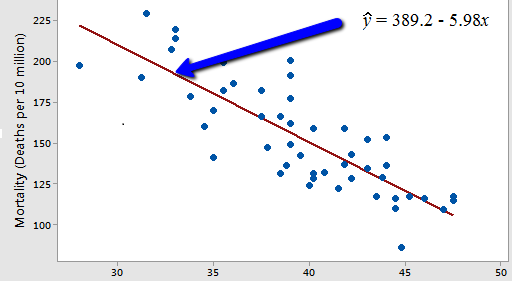
Skin cancer mortality rate vs latitude: onlinecourses.science.psu.edu/stat462/node/91/


