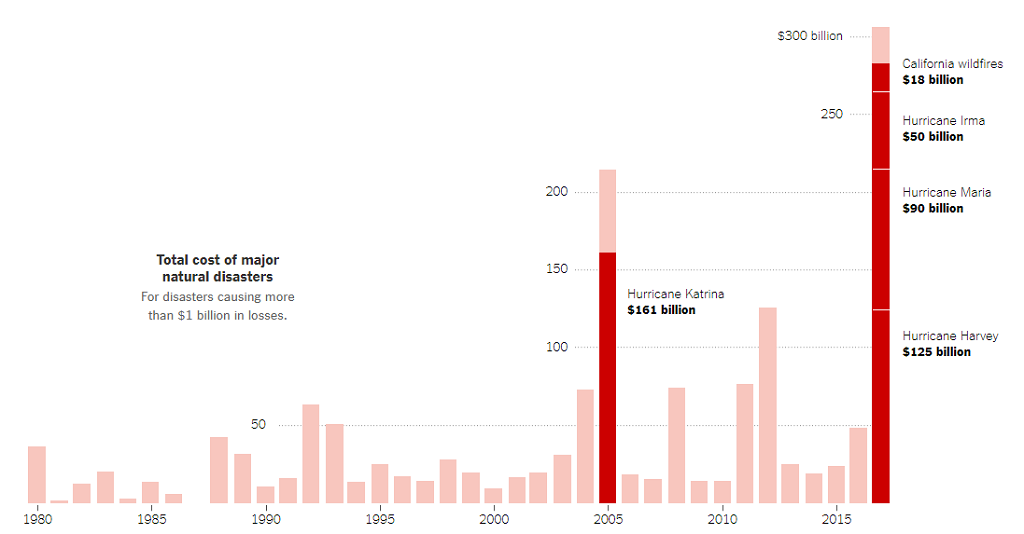
This graph shows us the total cost of major natural disaster from 1980-2015. Throughout those years, each disaster cause over $1 billion in losses. As you can see on the graph it shows that in 2005 and 2015 there was over $100 billion in losses. In 2005 Hurricane Katrina did lots of damages that there was a lost of $161 billion. On the other hand, in 2015 there were four different disaster, in which it lead to a loss of $283 billion. Overall, according to this graph the U.S has lost more money from 2005-2015 over natural disaster.

