Tag Archives: statistics

Assignment part 2

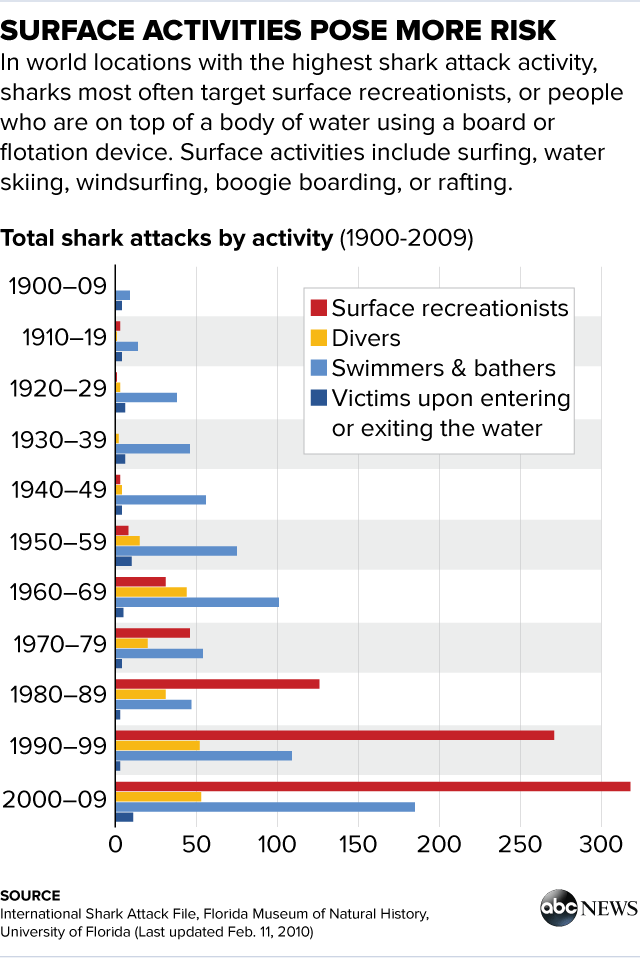
Data collected by the Florida Museum of Natural History at the University of Florida has broken down more than a century’s worth of shark attack data to put the most recent attacks in perspective.Ā People who are using some kind of flotation device on the surface of the water have been the most frequently attacked individuals in recent years, according to their findings.Ā The data shows that before such flotation devices, which include boogie boards, jet skis and surf boards became so mainstream, the people who were attacked tended to be swimmers and bathers. The graphs were used to explain the shark attacks, how frequent they were and which sharks attacked.

http://abcnews.go.com/US/shark-attacks-told-graphs/story?id=31779076

Online Assignment Part 2

3242

Description: This graph depicts income growth from 1917 to 2012. The author made sure to correlate his information with the chart above. By having his information correspond to the graph, the reader is then better able to understand the multiple trends in the graph above. Notably, an interesting trend can be seen from the graph above, from 1980 to 2010 income growth for the top 1 percent dramatically increased. On the other hand, from 1980 to 2010 income growth for the 90 percent has disturbingly stagnated.

Summary: In the article, ā€œThe Fall And Rise of U.S. Inequality, In 2 graphs,ā€ Quoctrung Bui, the author, goes into detail about inequality in the United States. According to the author, a phase called the great compression was a time when incomes rose for the bottom 90 percent. On the other hand, also during the great compression, the 1 percent of earners experienced a stagnant income growth. The author then explained how during these past 35 years ā€œmarginal tax ratesā€ fell, resulting in an income rise for the top 1 percent. Notably, also occurring during these past 35 years, the author said, ā€œā€¦a combination of global competition, automation, and declining union membership, among other factors, led to stagnant wages for most workers. ā€œ

http://www.npr.org/sections/money/2015/02/11/384988128/the-fall-and-rise-of-u-s-inequality-in-2-graphs

Graph about Unemployment Rate in Minnesota (Second Posting [Hannah Ally])

This article “In unemployment rate, a tale of two Minnesotas” by Bob Collins(MPR news) main focus was to cast an eye and find the cause of unemployment rate and in Minnesota. Over 5,000 jobs were lost and unless you were in health care, trucking, or the hospitality, you weren’t working. Also there are other major contributors to this great feat, which are longevity of unemployment, gender/age, and race. The race factor is mind boggling,people of color especially African Americans are discriminated against because the lack of education and a significant amount of criminal records in contrast to whites. “It adds additional support to a report last month that household income among blacks/African-Americans in Minnesota has plunged from 2013 to 2014. ”

Out of the three graphs that were presented in the article, I chose the graph on Ethnicity/ Selected Race. As you can see, African Americans have the highest unemployment rate, peak about 23% in 2011 with the low 10% in 2014. But you see that rate is rising again this year over 15%. For Hispanics the rate is gradually decreasing this year but the peak was for unemployment was 2010 at about 16%. Finally for Whites the graph shows the rate has roughly been under 5% and this year you can see that both Hispanics and Whites have come to a meeting point for unemployment at about 3% this year.

http://blogs.mprnews.org/newscut/2015/10/in-unemployment-rate-a-tale-of-two-minnesotas/

Mohammed Hossain Post .. How Statistics Relates to My career.

Mohammed Hossain

Instructor: Ezra Halleck

Math 1372


Hello, my name is Mohammed Hossain. At this point, my Prospective career is to become a computer scientist and a programmer. When I was in high school I really got interested in computer field. Programming is really fun and I love it. The most interesting part about being a computer scientist is you are able use computer to do many things such as explores new ideas, creating more breakthroughs and Ā use them in our daily life. Also, you can be a game developer build different types of games, websites, robots etc. I believe that statistics and probability plays a major role in every field especially in computer science. For example, computer science is like a giant calculator that computes all the data like statistics does. Statistics help computer to do the entire math faster, without statistics it will be hard for human to calculate the average of huge data. Then algorithm will be harder for human being because the main job of algorithm is to match raw data. In computer field we use both statistics and probability to do data mining, date compression, speech recognition, and data recovery and retrievals etc. Furthermore, Programmers use probability to measure the success of the program before running it. Probability is also used to solve paradox probability have been now playing a very big role in computer programming. Overall, statistics and probability deeply plays an essential role to the field of computer science.

Hello,

My name is Anthony Serrano and my major is Biomedical Informatics!

As almost any other profession that you can think up of, Biomedical Informatics takes advantage of the mathematics field. Indeed, statistics can be a great tool to make sense of data and information. So what is data and information to a medical Informatician? Data is raw information, whereas information processed data. Ā Medical Informaticians usually derive their data and information from a health care system. By using statistics in certain ways, we can derive knowledge from information. And so we have the following: 1) Data is turned to information; 2) Information is then turned to knowledge.

By acquiring knowledge (i.e., to use for decision making) from the above process–using mathematics to make sense of the data and information–and using it effectively, health care organizations can cut down on their ever-increasing health care costs. Ā To address the ever-increasing cost of health care in the U.S., perhaps we can look to statistics to look for an alternative to Obama Care (PPACA 2010).

Anthony S.
Snapshot_20150927_204002