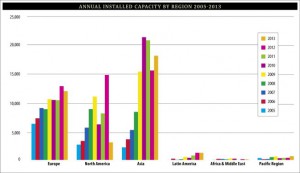
This graph was created in July 2014. This graph is showing that as of July 2014, Asia is leading the world for installed wind capacity by region.
-
Recent Posts
Recent Comments
Archives
Categories
Meta
This graph was created in July 2014. This graph is showing that as of July 2014, Asia is leading the world for installed wind capacity by region.
Our goal is to make the OpenLab accessible for all users.
Our goal is to make the OpenLab accessible for all users.


Reference (link)? How was this used in the original article? Is this all you can say. First of all, is this giving installed wind capacity or NEW capacity? Can you write a bit more on what you observe for the 3 dominant regions?