Categorical vs quantitative variables
Quantitative variables are any variables where the data represent amounts.
Categorical variables are any variables where the data represent groups.
Example
Survey 100 students, record:
- height
- gender
- hair color
- age
Which variables are categorical? Which are quantitative?
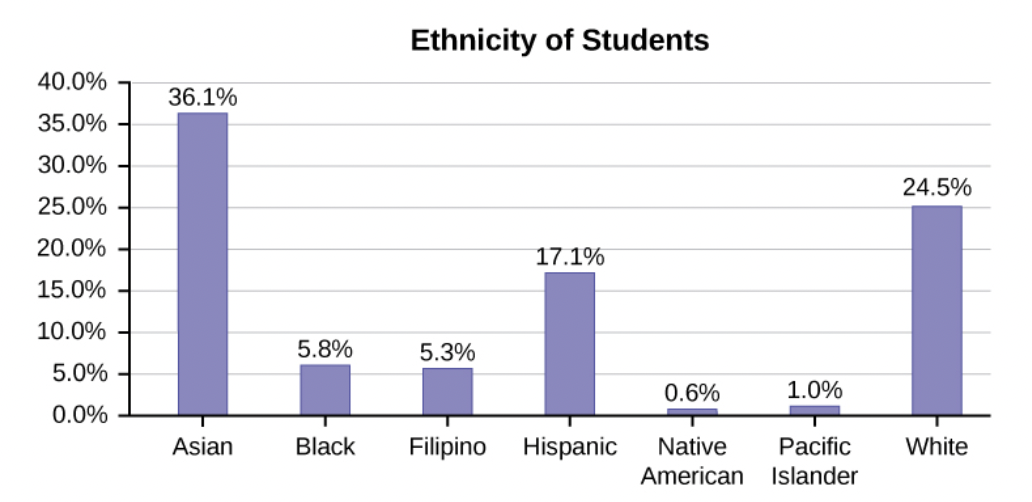
Typical question: What is the probability that a randomly selected student is Filipino?
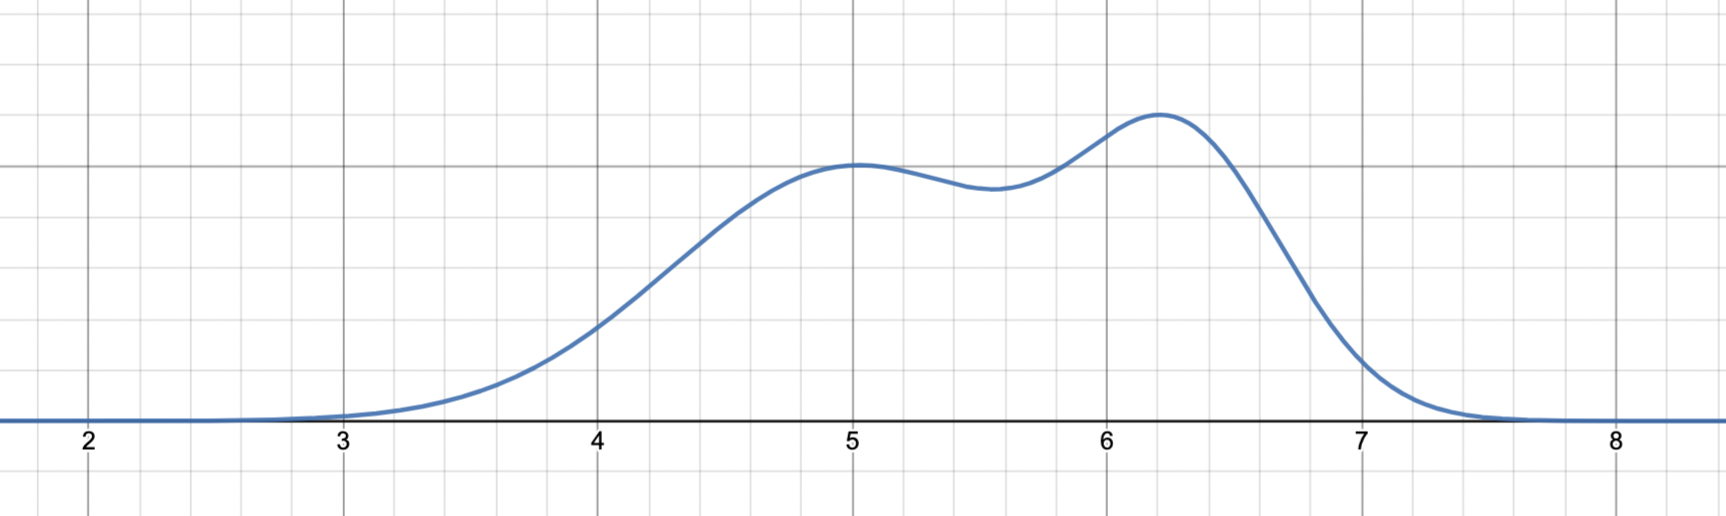
Typical question: What is the probability that a randomly selected student is between 5 and 6 feet?
The normal distribution
Cool and handy fact: An enormous number of different kinds of continuous real-world variables have the same shape – the bell curve (or normal distribution).
This curve is based on the function $y=e^{-x^2}$, with constants added in appropriate places to make the values work out correctly (total area = 1, inflection points at +-1, and so on).
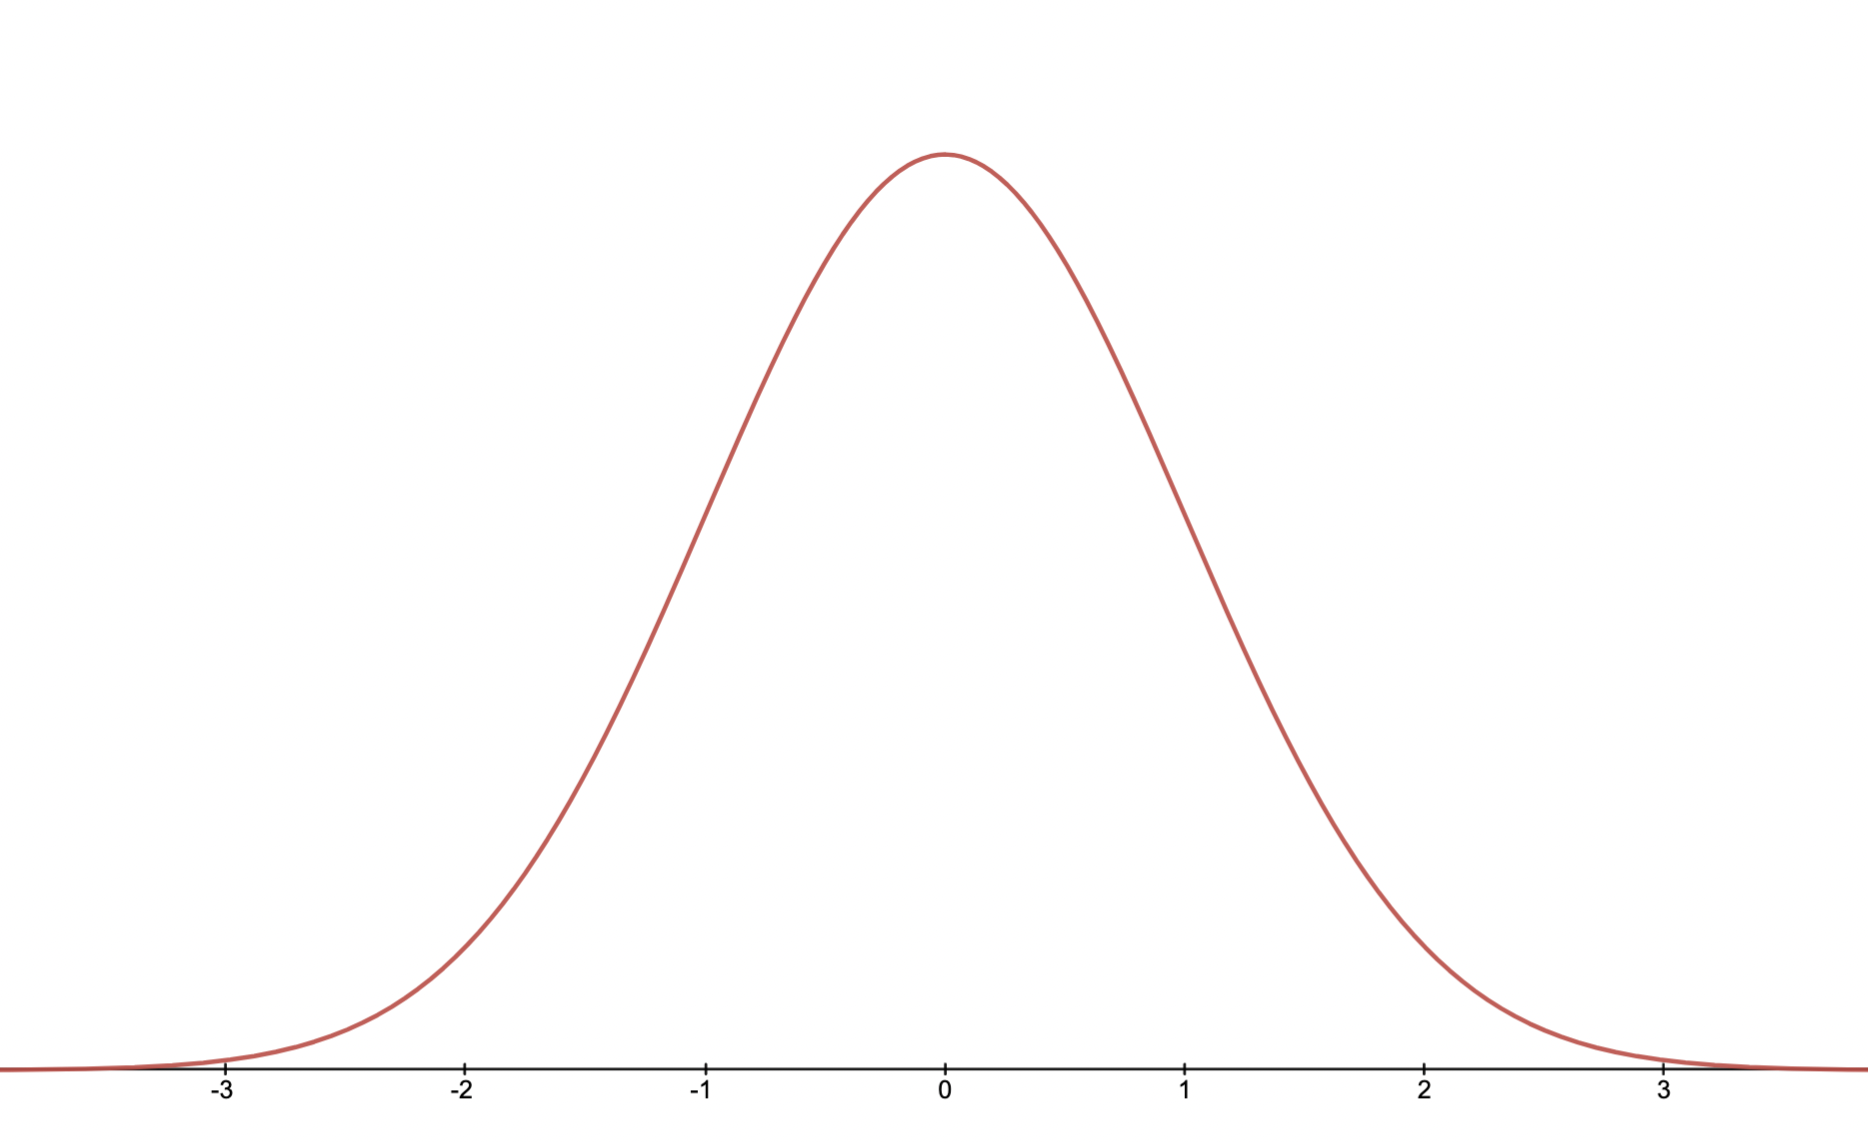
The normal distribution with mean $\mu=0$ and standard deviation $\sigma=1$ (this is the “basic” normal distribution – we often use $z$ as a variable to set it apart): $f(z)=\frac{1}{\sqrt{2 \pi}} e^{-\frac{1}{2}z^2$.
Normal distributions with different mean and standard deviation
What if our random variable is measuring height? Then the mean will not be $\mu=0$ ft — it’s more likely the mean will be something like $\mu=5.8$ft. And the standard deviation may not turn out to be $\sigma=1$.
The normal distribution with mean $\mu$ and standard deviation $\sigma$: $f(x)=\frac{1}{\sigma \sqrt{2 \pi}} e^{-\frac{1}{2}\left(\frac{x-\mu}{\sigma}\right)^{2}}$.
Example 1
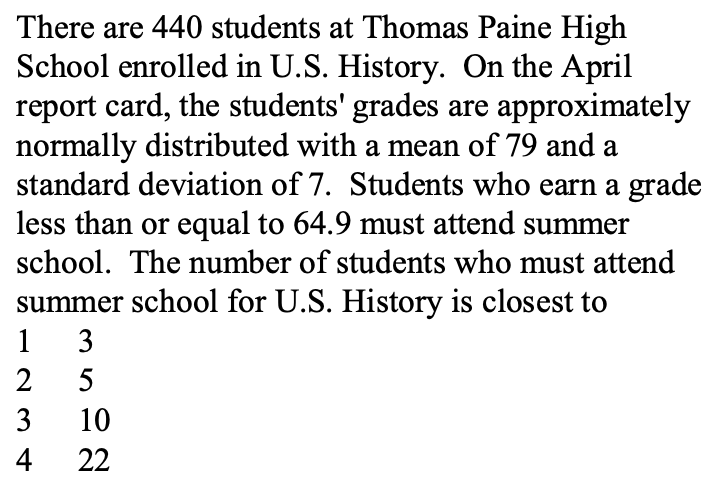
How do we actually calculate probabilities using the normal distribution?
Option 1. For certain simple values, use the 68-95-99.7 rule.
Option 2. Use the TI-84+ calculator.
- Press
2nd Distr - Press
2:normalcdf(lower bound, upper bound, mean, standard deviation) - Example:
normalcdf(-1000,-64.9,79,7)
Option 3. Use the formula. In particular, calculate the area under the normal distribution curve $f(x)$ from the left bound to the right bound.
$$\int_a^b \frac{1}{\sigma \sqrt{2 \pi}} e^{-\frac{1}{2}\left(\frac{x-\mu}{\sigma}\right)^{2}} dx$$
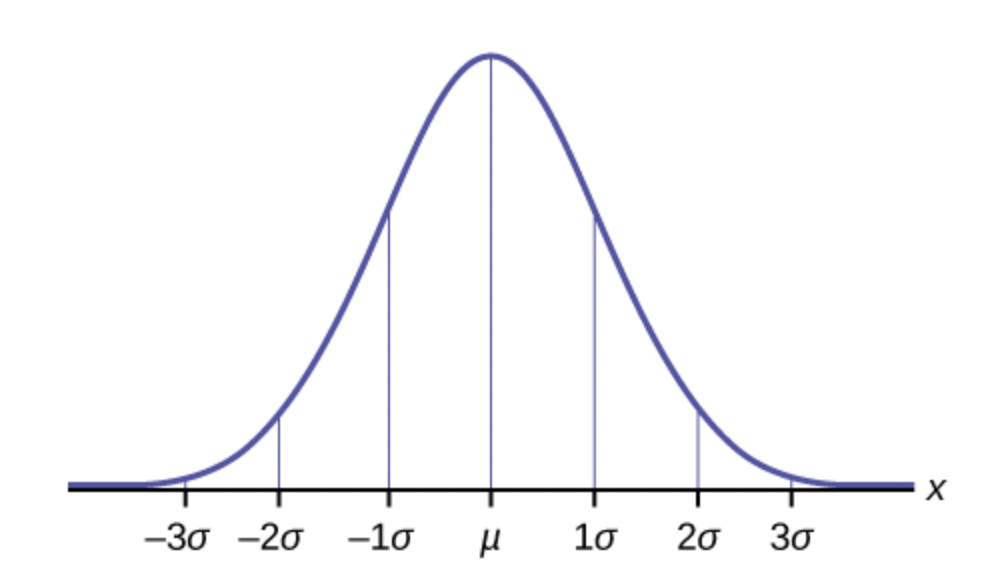
What is the 68-95-99.7 rule?
- About 68% of values fall within one standard deviation of the mean.
- About 95% of the values fall within two standard deviations from the mean.
- Almost all of the values—about 99.7%—fall within three standard deviations from the mean.

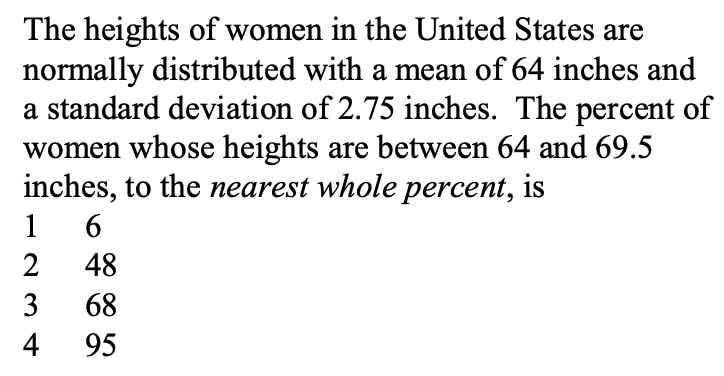
Example 2
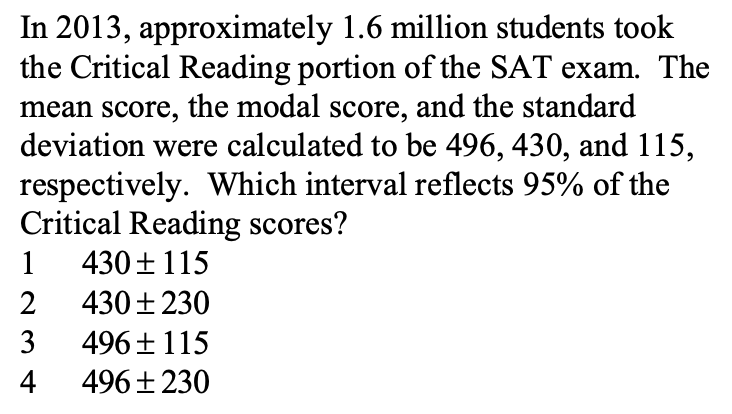
Example 3
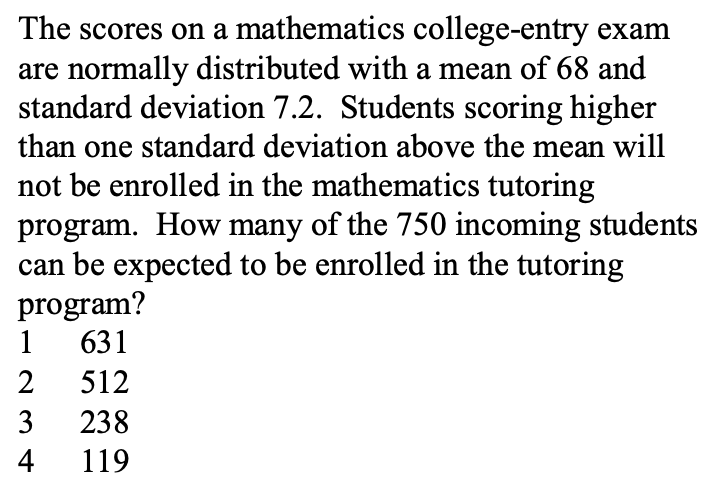
Example 4
Resources on Probability and Statistics
- The Bear in Moonlight – Math With Bad Drawings’ 7-part series on probability (disguised in story form)
- OpenLab course hub for MAT 1372 (Probability and Statistics)
- Introduction to Probability from OpenStax textbook on Probability
- Adjustable spinner (change # of categories and probability of each, then simulate spins)


0 Comments
1 Pingback