Blog

Colleges and “Economic Mobility” Statistics

A group of economics/statistics researchers at Harvard University have a project called Opportunity Insights: “Our mission is to develop scalable policy solutions that will empower families throughout the United States to rise out of poverty and achieve better life outcomes.”

In 2017, the NYT published an op-ed (titled “America’s Great Working Class Colleges“) on one of their research projects: “The most comprehensive study of college graduates yet conducted, based on millions of anonymous tax filings and financial-aid records….the study tracked students from nearly every college in the country (including those who failed to graduate), measuring their earnings years after they left campus. The paper is the latest in a burst of economic research made possible by the availability of huge data sets and powerful computers.”

The op-ed discusses CUNY specifically, and has a handful of graphs showing some of the data.  But the NYT also created an interactive website which lets you explore the data for any college in the country. Take a look:

https://www.nytimes.com/interactive/projects/college-mobility

(The relevant concept from our course is that of percentiles; the data that is given is in terms of students’ family income percentiles, and specifically quintiles.)

Quiz #3 – Wed 30 Oct

Just a reminder that we will take Quiz #3 in class tomorrow (Wednesday Oct 30).

Please work through as much of “HW7-ConditionalProbability” as you can before class; the quiz will consist of one or two quick exercises based on the exercises in HW7.

In particular, make sure you understand Exercises #3-7 from HW7.  It may be helpful to have the conditional probability class outline pdf open while you do the homework.


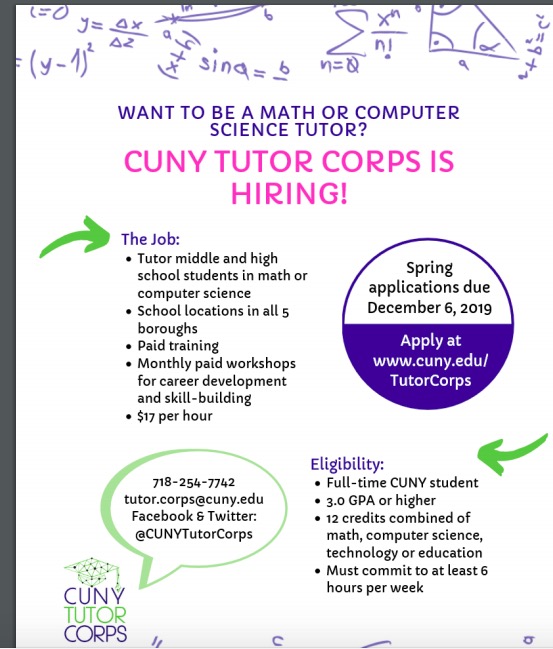
Job opportunity: CUNY Tutor Corps

See CUNY Tutor Corps’ website if you’re interested in a part-time job tutoring middle school and/or high school students in math or computer science.

This would be great experience if you’re at all interested in a career in teaching (but even if you’re not necessarily interested in purusing teaching, it would be a great way to strengthen your own math and communication skills).

CUNY Tutor Corps flyer

Statistics Textbooks

I have been encouraging you to read the relevant sections of the course textbook (Introductory Statistics by Sheldon Ross), since it helps a lot to read the material we cover in class, and especially to study more examples.

But since everyone may not have ready access to the textbook (although it is on reserve at the CityTech library), I will post links to online statistics textbooks here:

Math Club talk on “Probability and Games” – Thurs Oct 10

Please note that the college is closed both tomorrow (Wed Oct 9) and next Monday (Oct 14), so we won’t have class again until Wed Oct 16.  In the meantime, please review the introductory material on probability we started discussing yesterday, and start working on the “HW5-Probability” WebWork set (due Fri Oct 18).
In addition, I wanted to let you know about a Math Club talk on Thursday which is very relevant to our course. I will be there, and I strongly encourage you to attend if you can. (To incentivize you to attend, you will earn 1pt towards your participation grade if you do attend!  Also, you get free pizza.)

Here are the details (taken from the Math Club’s OpenLab site):


Date: Oct. 10, 2019

Time/Room: 12:45-2pm in N1002

Speaker: Johann Thiel (NYCCT)

Title: Probability and Games

Abstract: In this talk we will analyze various games of chance, including the Monty Hall Problem and Race to the Finish from Let’s Make a Deal and Plinko from The Price is Right. We will use both theoretical and computational methods to understand the probabilities of winning such games.


Pizza will be served at 12:45pm.

Exam #1 – Wednesday, Oct 2

As I announced in class, we will take our first midterm exam next Wednesday (Oct 2).  The exam will cover the material up to and including linear regression.  See below for some tips on how to prepare for the exam.

Note that since the college is closed on Mon Sept 30 (& Tues Oct 1), the exam will be during our next class meeting. The exam should take no more than one hour to complete, so we can use the first 30mins of class on Wednesday to discuss any questions that come up as you study for the exam.

To prepare for the exam:

  • start by finishing WebWork set “HW4-PairedData” (due Sunday, Sept 29 at 6p)
  • review the outlines/notes/spreadsheets for Classes#1-8 (available under Files and the Schedule page)
  • review the WebWork exercises and solutions from “HW2-Graphs”, “HW3”, and “HW4-PairedData” (solutions for HW4 will be available Sunday evening immediately after it closes; solutions for the previous two HW sets are available now)
  • in particular, review the following WebWork exercises:
    • HW2-Graphs: #2, 3, 4, 10, 11, 13, 14
    • HW3: #1, 2, 3, 5, 10
    • HW4-PairedData: #1, 3, 6, 13, 14, 20, 21, 22

Commute Time Project

You can find the pdf of the Commute Times Project description I handed out yesterday in Files.

Also, here is the link to the spreadsheet I showed at the end of class:

https://docs.google.com/spreadsheets/d/1y5tJReURqLDeYlTOxzFCwUChvCFRa__d5aIgtDnt41o/edit?usp=sharing

Please set up a basic spreadsheet and start recording your commute times!

(In the spreadsheet above, I had recorded “Departure time” and “Arrival time,” and then computed commute time by subtracting “Departure time” from “Arrival time.”  Especially if you’re using a stopwatch app to record your commute time, it’s fine to just record that directly (i.e., set up a spreadsheet with “Date” in column A and “Commute Time” in column B.)

Khan Academy course: “Statistics and probability”

As I mentioned on the first day of the semester, there are many online resources that you can consult to help you learn/review the material we cover in class.

Here is a full Khan Academy “Statistics and probability” course, which covers much of the same topics we will discuss this semester.

In particular:

Try watching some of the Khan Academy videos to see if you find them useful.

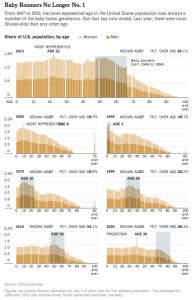
“The Aging of America”: Frequency Histograms For US Population Age Distributions

Here are some examples of frequency histograms showing the age distributions of the US population at different times in history (and projected into the future):

A similar post appeared on WashingtonPost’s Wonkblog: (published: August 13, 2013)

  • “This is a mesmerizing little animation created by Bill McBride of Calculated Risk. It shows the distribution of the U.S. population by age over time, starting at 1900 and ending with Census Bureau forecasts between now and 2060.”

What do you notice about how the distributions evolve over time? Click thru to either the CalculatedRisk blog post on which this animation first appeared or to the WashingtonPost link to read some discussion.

Also here is a related set of histograms that were featured in the NYT Business section in May 2014, as part of an article titled “Younger Turn for a Graying Nation“:

NYT-graying

That was an installment of a weekly column in the NYT Business section titled “Off the Charts,” which discussed a graph and the underlying data.